Idle or working? One line of JEXL tells them apart
TL;DR. A truck parked with its engine running is either wasted fuel or paid power-take-off work, and speed reads zero either way. One line of IoT Logic expression reads the status bit that tells them apart. In this walkthrough an agent assembles the whole rule through the API — it reads the live schema, builds the graph, enables it, streams telemetry — and an independent channel then confirms the rule computed what you meant. The visual canvas stays as the human's place to review, approve, and debug.
A truck sits for ten minutes with its engine running. Waste or work? Maybe the driver is warming the cab and burning diesel for nothing. Or the engine is driving a power take-off — running a pump, turning a crane — which is billable work the fleet gets paid for.
Speed can't separate the two: both read zero. Fuel burn barely can; it looks the same. The difference hides in a single bit of a status word the vehicle's gateway sends.
The whole trick, before the details: one IoT Logic expression reads that bit and turns "parked, engine on" into two opposite verdicts — and an independent stream, the one that never wrote the rule, proves the rule computes what you meant.
One point first. IoT Logic has a visual drag-and-drop editor where you place nodes on a canvas and wire them — convenient, and a real strength. It also has a documented programmatic surface: a flow is a typed schema you read and write over REST, the docs carry an AI flow-generation guide, and the platform exposes a read-only MCP server for auditing. That surface is what lets an agent work against a contract rather than a screen.
In the run below, the agent does the whole loop on a disposable test account: it reads the live schema, assembles the graph, enables the flow for the test, streams telemetry, and disables it again. The canvas doesn't disappear — a human opens the same flow and the Data Stream Analyzer to review the graph, approve the enable in production, check the install on the truck, and debug. The agent assembles; the human keeps the enable gate and the verification.
The answer is one bit in the status word
Here is what comes off the wire — one integer, a packed status word:
can_status_word = 4   # 0b100 — PTO off
can_status_word = 5   # 0b101 — PTO engaged (bit 0 set)
The number arrives in the platform as an ordinary numeric telemetry field. The gateway packs the status word — the bus parsing and packing happen on the device — so inside the rule you work with the delivered value, no firmware and no external service.
This is a synthetic status word, packed the way a gateway would pack it; take the real bit layout from your device contract or DBC, not from this post. Bit 0 is an illustrative position, chosen to show the technique — you drop in the offset of your own real PTO signal.
util:checkBit — the whole decode in one line
IoT Logic has an expression language — the same JEXL you have seen in a dozen other tools, plus a few bit helpers. Pulling the bit you need looks like this:
util:checkBit(can_status_word, 0)
Add speed and you get three computed attributes. The meaning of each is one phrase on the right:
pto_engaged     = util:checkBit(can_status_word, 0)
wasteful_idle   = speed < 3 && !util:checkBit(can_status_word, 0)   # parked, PTO off
productive_idle = speed < 3 &&  util:checkBit(can_status_word, 0)   # parked, PTO on
In production you would AND an ignition or engine-on signal into speed < 3, so "parked" means the engine is truly running; here speed < 3 stands in, to keep the focus on the PTO bit — the part speed can't give you.
That is the entire "decoder": three expressions in a rule node, no microservice or backend parser to maintain. Each produces a boolean the flow branches on — wasteful_idle true is the condition you would act on. Turning a boolean into an actual notification is a separate step (a sensor or rule on top); this flow only computes and routes. The syntax and full list of bit operations live in the Navixy expression reference.
The rule itself is a plain four-node graph, built through REST: a data source, a computed-attributes node, a logic node, and one output endpoint. It carries no action and no webhook — the rule computes and routes, but commands nothing. The first write goes in with enabled:false, so even a correct graph will not touch data until a separate, checked enable.
The agent builds the graph; you open it to check
The same graph the agent assembled through the API opens in the visual editor as an ordinary flow — node by node:
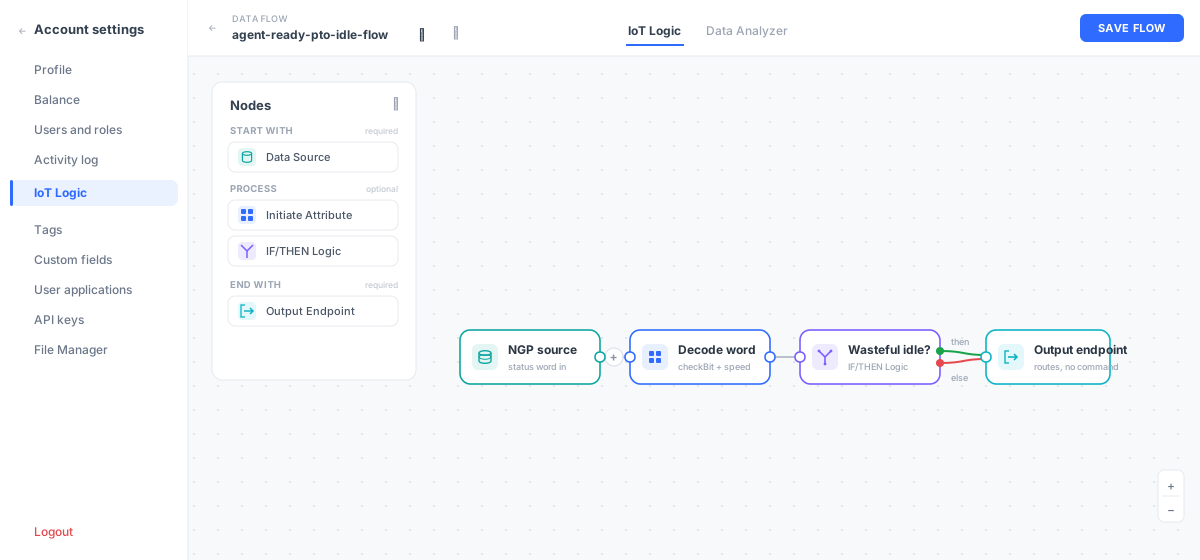
Nobody dragged a node. But nothing is hidden either: a human opens this screen, sees the same four nodes and the branch, edits any of them, or disables the flow with one switch. The canvas is where the agent's work becomes reviewable.
One bit flips the verdict at zero speed
Building the graph is not enough — you have to see it computes what you intended. Whether the graph survived the write is answered by reading it back; how the rule behaves on live data is a separate channel, the Data Stream Analyzer (DSA). Subscribe to the DSA WebSocket stream, send three telemetry packets — one per state, each with its own speed and status word — and DSA independently shows what the rule computed.
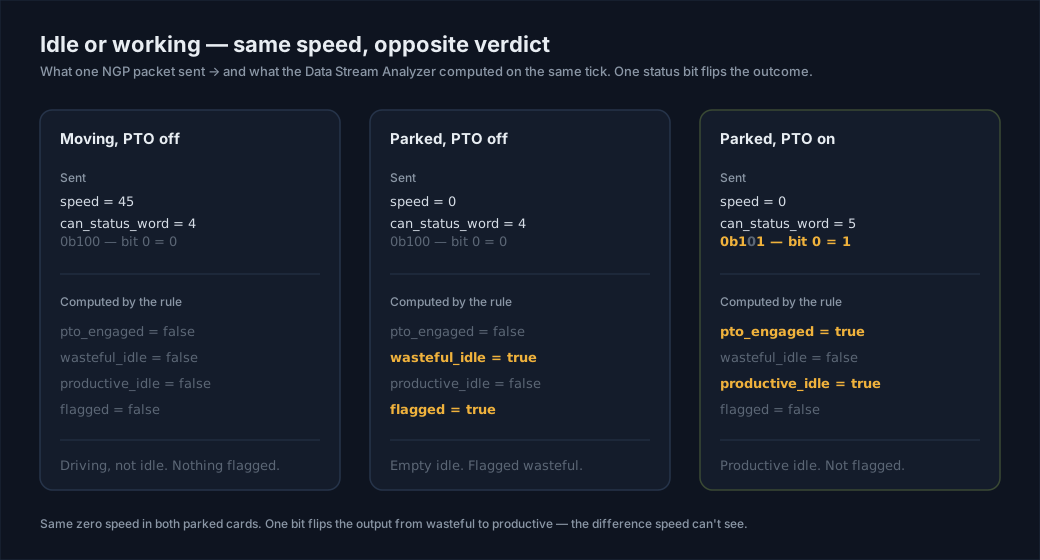
| What one packet sent | What DSA showed on the same tick |
|---|---|
speed=45, can_status_word=4 — moving, PTO off |
pto=false, wasteful=false, productive=false, flagged=false |
speed=0, can_status_word=4 — parked, PTO off |
pto=false, wasteful=true, productive=false, flagged=true |
speed=0, can_status_word=5 — parked, PTO on |
pto=true, wasteful=false, productive=true, flagged=false |
Read top to bottom. Moving isn't idle at all, so nothing is flagged. The truck stops with PTO off — wasteful goes true and flagged with it: there is the empty idle. Change one bit of the status word, keep speed at zero, and the picture inverts: flagged clears and productive goes true. Same standstill, opposite verdict — exactly the difference speed can't see.
One detail makes this proof rather than coincidence. Each packet carries a unique marker, and the check looks for exactly one DSA tick with that marker, then compares sent and computed fields inside that tick. Speed from one message can't be accidentally glued to a status word from another. That is the load-bearing habit here: the proof comes from a channel that never wrote anything.
Here is the whole run reduced to four values — a synthetic run on a disposable test account, three states matched on their ticks, the rule left disabled after the check:
{
  "status": "succeeded",
  "dsa_verified": true,
  "final_disabled_verified": true,
  "inventory_verified": true
}
Who does what: the agent writes, the canvas checks
Each actor owns one part, so no single answer is taken on faith for all the others:
- The agent, over REST, writes the configuration and confirms by reading it back that the graph and
enabled:trueactually persisted. - NGP accepts the telemetry; its HTTP 200 speaks only to delivery.
- DSA independently shows the computed result on the stream.
- User MCP stays on the read side — the User MCP server reads and audits it, while every mutation goes through REST.
- The human works in the visual editor: validates the agent-built flow, approves the enable, checks the data on the installed truck, debugs through DSA, holds the switch, and owns the key. That is the control point — human-in-the-loop on top of the agent.
In practice, the default I would keep is this: treat a rule as working not when create returned success, but when a channel that took no part in the write shows the result you expected. The direct-REST route has an in-product sibling, too — the Navixy AI Assistant, where the assistant assembles the flow and a human confirms. Both land on the same object on the same canvas.
When you don't need to decode a bit
This technique pays off in a narrow place. If your gateway already exposes a ready "PTO on" flag as its own field, take that field as is and decode nothing. If the question is one-off and the data is small, an export to a spreadsheet and ten minutes will beat any rule.
Bit decoding in IoT Logic earns its place when the signal arrives packed, in a stream, continuously, and you want to tell states apart on the fly instead of reconstructing them from logs after the fact.
Your signal: what to change, what to keep
Swap can_status_word and the demo bit for a real numeric field from your tracker or gateway, and drop in the offset your device contract or DBC assigns to the signal you care about. Keep the rest of the order: live schema first, then build with enabled:false, read back, a full update on enable, and a DSA check keyed to a unique marker.
The one command worth running by hand first is the preflight — read the live schema and confirm your deployment has the node types it needs. The key is created once in Account Settings → API Keys and read from an environment variable:
curl -fsS \
  -H "Authorization: NVX ${NAVIXY_API_KEY}" \
  -H 'Accept: application/json' \
  'https://api.us.navixy.com/v2/iot/logic/flow/schema'
After that, the three expressions above and a read-back after every write. Read-back confirms the flow persisted as written; the independent DSA check confirms it computes the states you meant.
All of this stays as discrete calls with read-back and a DSA check for a reason: every step then has a machine-checkable pass or fail — one match on a label lookup, one DSA tick with its unique marker, a final enabled:false confirmed by a read. The typed schema, the AI flow-generation guide, and the read-only MCP exist so an agent can run that loop.
The editor is the familiar way to build a flow, and that is convenient. But I would bet graph assembly keeps moving to agents, while the canvas and DSA stay where a human validates, checks the install, and debugs — leaving one operation you can't delegate: create the key, and revoke it.
On this page