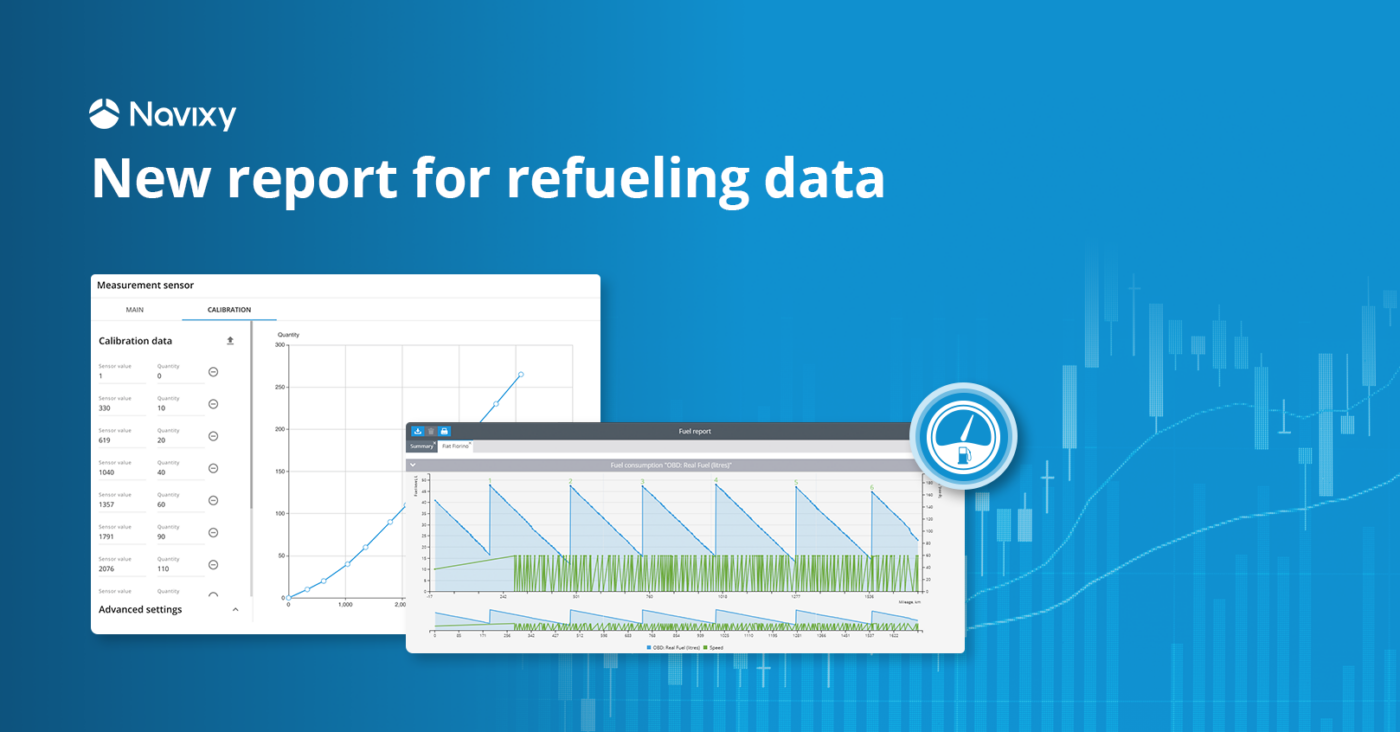
A recent survey of our customers revealed an interesting trend in fuel data: the classic case of draining fuel by pumping it from the car tank into a jerry can is becoming less and less common. Instead, unscrupulous workers are resorting to more sophisticated and cunning methods of fuel theft. Now, some of the most popular forms involve manipulations performed directly at gas stations, such as inflating a company vehicle's volume of fuel, and using corporate fuel cards to partially drain fuel into their own canisters.
In light of these new theft methods, having a reliable tool to monitor and analyze refueling data has become even more important to accurately compare the actual volumes of fuel dispensed with those indicated on the receipts issued at fuel stations, providing quality information for decision-making.
New algorithm: new quality level
The Navixy Labs engineering team has spent the last few months working on a new algorithm to analyze and process fuel data for a new report to provide clients with up-to-date fueling information. In developing the interface, we took a "minimal settings" approach that automates the process of using data noise reduction and graph smoothing parameters for trackers and sensors, making it easier for clients to get the most out of their data. Now, in addition to fuel gauge readings, only two criteria are needed for calculations: the billing table and the maximum tank volume. All other parameters are already preset and automatically adapted to the sensor and tracker type.
In addition to user-friendliness, we placed emphasis on the accuracy of fueling detection and its details. The new algorithm has reduced the probability of recognizing false refuelings and increased the accuracy of detecting real ones. Another aspect is the accuracy of the calculation of the Filling attributes: the new algorithm can determine the time of the Filling event with a deviation of just minutes for the vast majority of cases and, most importantly, it improved the accuracy of determining the volume of fuel at refueling. Now, the probable deviation of the calculated values from the real ones is just a few percent for most modern fuel level sensors.
Noiseless data: the key to accurate calculations
The new algorithm is based on our own developments, which we obtained from analyzing data noise received from fuel level sensors. The algorithm is based on the Fuel Sensor Quality Index (FSQI), developed by Navixy, which aims to improve the accuracy of fuel monitoring. The FSQI assesses the reliability of data received from sensors, ranging from low to high quality, depending on sensor type and technology. This index helps identify sensors that require maintenance or replacement, as well as reduces false positives to improve accuracy.
Another feature of the algorithm is calibration table analysis. The analysis shows that incorrectly completed tables can lead to significant errors in fuel consumption reports caused by inaccurate interpretation of fuel levels. In fact, incorrect calibration is responsible for nearly 22% of all measurement discrepancies. Even high-accuracy-embedded fuel level sensors cannot work effectively if the calibration tables are poorly populated. Therefore, filling out the calibration table correctly is key to maximizing data correctness in fueling reports.
New report: quality and usability
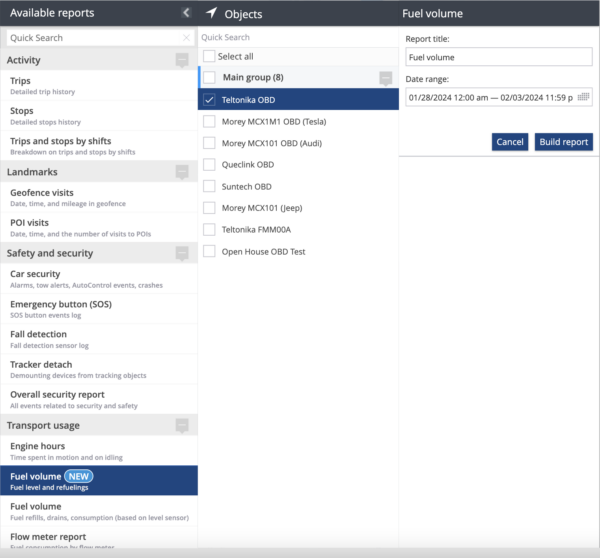
The new report, based on modern computational models, is easy to use. All smoothing, invalid point, and outlier filtering settings are applied automatically. To create a new report, go to "Reports" and select "Fuel Volume NEW". Specify the objects to be analyzed, name the report, and set the time interval. After that, click "Create" and you will get a ready report.
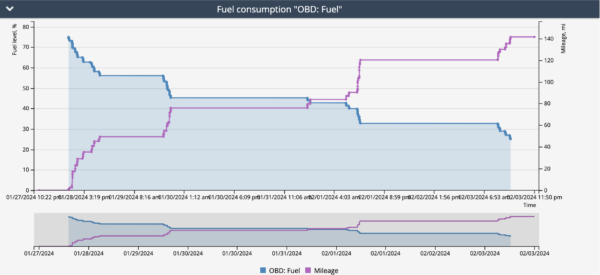
This report features an improved graph and table with detailed information on gas stations. The graph, cleaned of unnecessary data, reflects the change in fuel level and vehicle activity. The table allows you to compare actual fueling data with information from your CRM or ERP system, enabling you to identify possible discrepancies in the amount of fuel dispensed and the timing of refueling.
In-depth analysis: anomalies and patterns in fuel consumption
By pinpointing gas stations as key events that affect business metrics, we can delve deeper into the work of correctly understanding fuel consumption. This includes identifying patterns, default values, and, of course, anomalies. With fraud becoming increasingly sophisticated, we aim to expand our understanding of how company vehicles are misused. Our goal is not only to identify obvious cases of fuel draining, but also to detect areas of anomalous fuel depletion. This data will be calculated using machine learning and artificial intelligence models.
Our new fuel report is now available on the Navixy platform. If you have any questions, please contact us today. You can also create an account to see the platform in action for yourself.
