- Managing telematics data flows is challenging due to data volumes bearing the potential for missing critical insights.
- Combining real-time and historical data analysis helps detect trends, anomalies, and data issues more effectively.
- Navixy IoT Logic Data Stream Analyzer efficiently manages telematics data by storing the last 12 parameter values, separating valid data from null values, and using a distributed cache for quick data access and analysis.
Businesses dealing with telematics face a common challenge—vast amounts of data from various devices can be hard to monitor and analyze in real time. Many companies rely on post-event data analysis, leading to delayed troubleshooting, missed anomalies, and inefficient decision-making.
What if there was a way to instantly examine data streams, pinpoint anomalies on the go, ensure complete and valid data at all times, and go with a deeper analysis when needed?
Navixy’s Data Stream Analyzer makes this possible with real-time monitoring, historical views, and customizable data displays. It helps you transform chaotic data into clear, actionable insights.
In this article, we’re taking a 360-degree view of Data Stream Analyzer and how to use it to optimize telematics data management.
Getting to know Data Stream Analyzer
Data Stream Analyzer is a component of IoT Logic, Navixy’s low-code/no-code telematics data processing platform. While IoT Logic focuses on overall data management and enrichment, Data Stream Analyzer performs real-time and historical data monitoring, ensuring data integrity and troubleshooting issues efficiently.
With this product, we aim to help customers get the most out of their telematics data.
Denis Demianikov, VP of Product Management in Navixy, explains how we approach making telematics management easier in our products:
We strive to harness the evolution in technology in our solutions, simplifying device management and IoT data streaming for telematics professionals with low-code/no-code tools and an effective data storage system, addressing the need for faster analysis and easier integration. This approach aligns with industry trends toward making technology more efficient, empowering professionals to concentrate on innovation and impact.
– Denis Demianikov, VP of Product Management at Navixy
Back to Data Stream Analyzer, Let’s explore the purpose of this solution, how it works, and why it matters.
So, what does Data Stream Analyzer do?
Data-driven businesses—fleet managers, logistics providers, IoT integrators, and more—depend on accurate, reliable data. Inconsistencies or delays lead to inefficiencies, higher costs, and security risks.
Data Stream Analyzer lets you observe the data as it streams to the platform, detecting hidden issues and resolving them to keep operations smooth and efficient. It’s like an X-ray for your data, helping you zoom in on the most relevant datasets instantly.
You can check and analyse specific tracker attributes in the data stream you’re receiving from your connected devices. Its mechanism of storing historical data, as well as debugging capabilities, which are used to work with these values, allow not only to observe the data in real time—something that Navixy’s Air Console does—but also to view the historical data in a convenient format for several devices at once, making data monitoring much easier.
Let’s break it down.
Precise data monitoring
Data Stream Analyzer allows you to focus on what matters by selecting specific devices and attributes for monitoring. Instead of sifting through massive amounts of data, users can pinpoint key parameters across selected devices, ensuring a clear and relevant view of telematics data.
For example, a fleet operator can monitor fuel efficiency trends across specific vehicles, while a logistics manager can track temperature fluctuations in cold-chain transport. The ability to filter out null values (see it further in more detail), exclude irrelevant data, and apply custom expressions ensures that businesses receive only actionable, high-quality insights, making more sense of their data streams.
Storage of the last 12 attribute values
A key advantage of the Data Stream Analyzer is that IoT Logic doesn’t just store the most recent attribute value from a device but retains the last 12 values. It provides a broader historical context, helping users detect patterns, spot inconsistencies, and analyze trends more effectively.
For example, rather than relying on a single data point, fleet managers can examine a sequence of fuel level readings to identify gradual declines or sudden drops, which might indicate fuel theft or sensor malfunctions. Similarly, tracking temperature fluctuations over multiple readings allows cold-chain operators to catch anomalies before they compromise cargo integrity.
The stored values are sorted by device time, preserving the exact chronological order of data generation. Thus, users can accurately reconstruct past events and decide based on a complete picture of telematics data. Additionally, users can refer to any of these 12 values using the IoT Logic Expression Language, allowing for precise calculations and advanced data analysis within automated workflows.
Including and excluding null values
If you need to retrieve only the last valid values of an attribute while filtering out null values, you can specify this directly in the IoT Logic Expression Language when writing functions and calculations. This ensures you always work with meaningful data, monitoring up to the last 12 valid values without disruptions caused by missing or incomplete entries.
For example, in Navixy IoT Logic, the Data Stream Analyzer allows you to observe how your calculations affect the data flow in real time. By relying on stored valid values rather than waiting for responses from the recipient’s system, you can troubleshoot issues faster and ensure greater accuracy in your analyses.
Higher performance thanks to fast data access
By storing data in memory with a distributed cache instead of a database, IoT Logic significantly accelerates access to historical values. It ensures real-time responsiveness, reducing delays in data retrieval and processing.
For example, to access the oldest valid value of the can_fuel attribute using the IoT Logic Expression Language, you can use the following query:
1 value('can_fuel', 12, 'valid')
This approach enables quick lookups and more efficient analysis, especially when dealing with large volumes of telematics data.
Mechanism for storing values in IoT Logic memory
Since Data Stream Analyzer relies on instant data access, let’s take a closer look at how IoT Logic efficiently stores and retrieves values.
To better understand it, we can visualise the data storage mechanism. The diagram below shows the process of recording values for both storages—All and Valid.
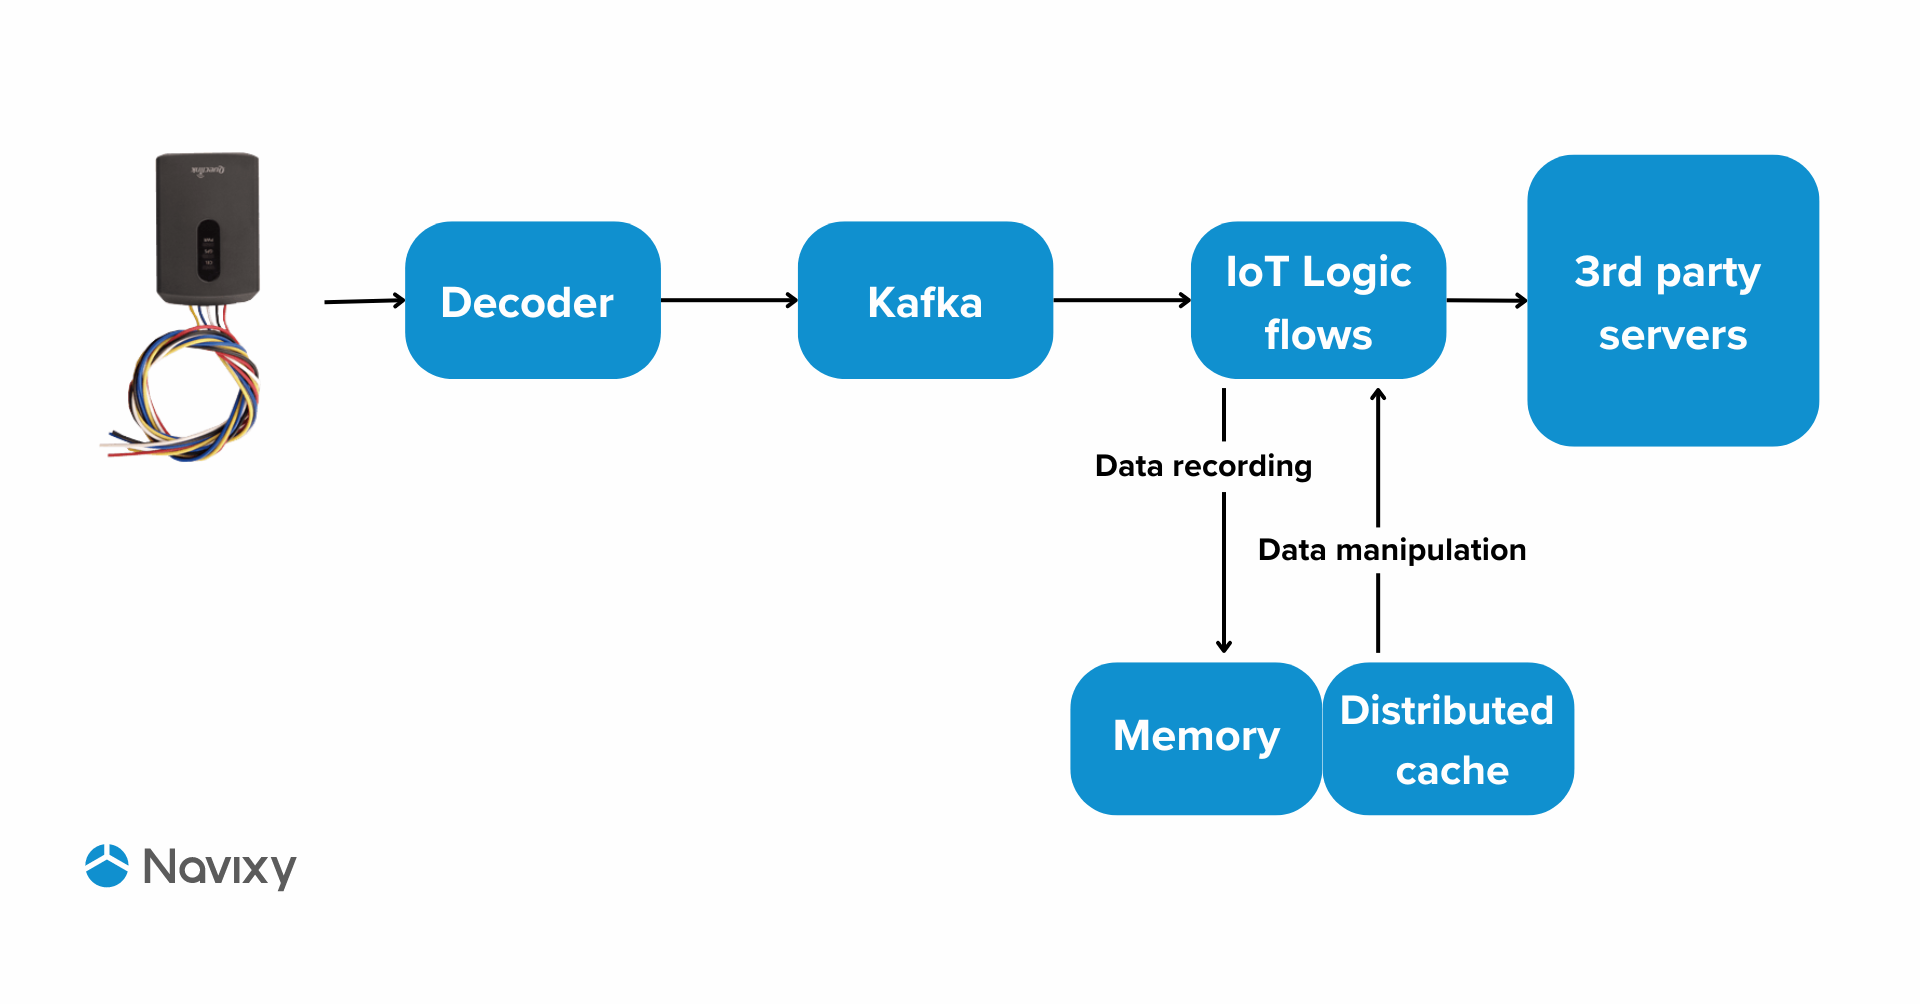
As you can see, the data is stored not in the database, but directly into memory, which has a positive effect on performance by providing instant access to values. Compared to databases, our method is much faster. This means that the Monitor tool can handle large amounts of data. At the same time, through the distributed cache, which is part of the memory, the data is used by other instances of the IoT Logic flows.
The IoT Logic product uses Hazelcast Map (IMap) as a distributed cache, which complements the memory used and gives the IoT product the ability to scale further.
Differences in the two storage mechanisms
Now let's take a look at the differences between the data recording process for the All and Valid store. In the image below you can see a simplified diagram of both processes:
- The data packet has a necessary value
- The data packet does not have a necessary value
For example, let's take the parameter temp1, which is responsible for the temperature value that the device sends.
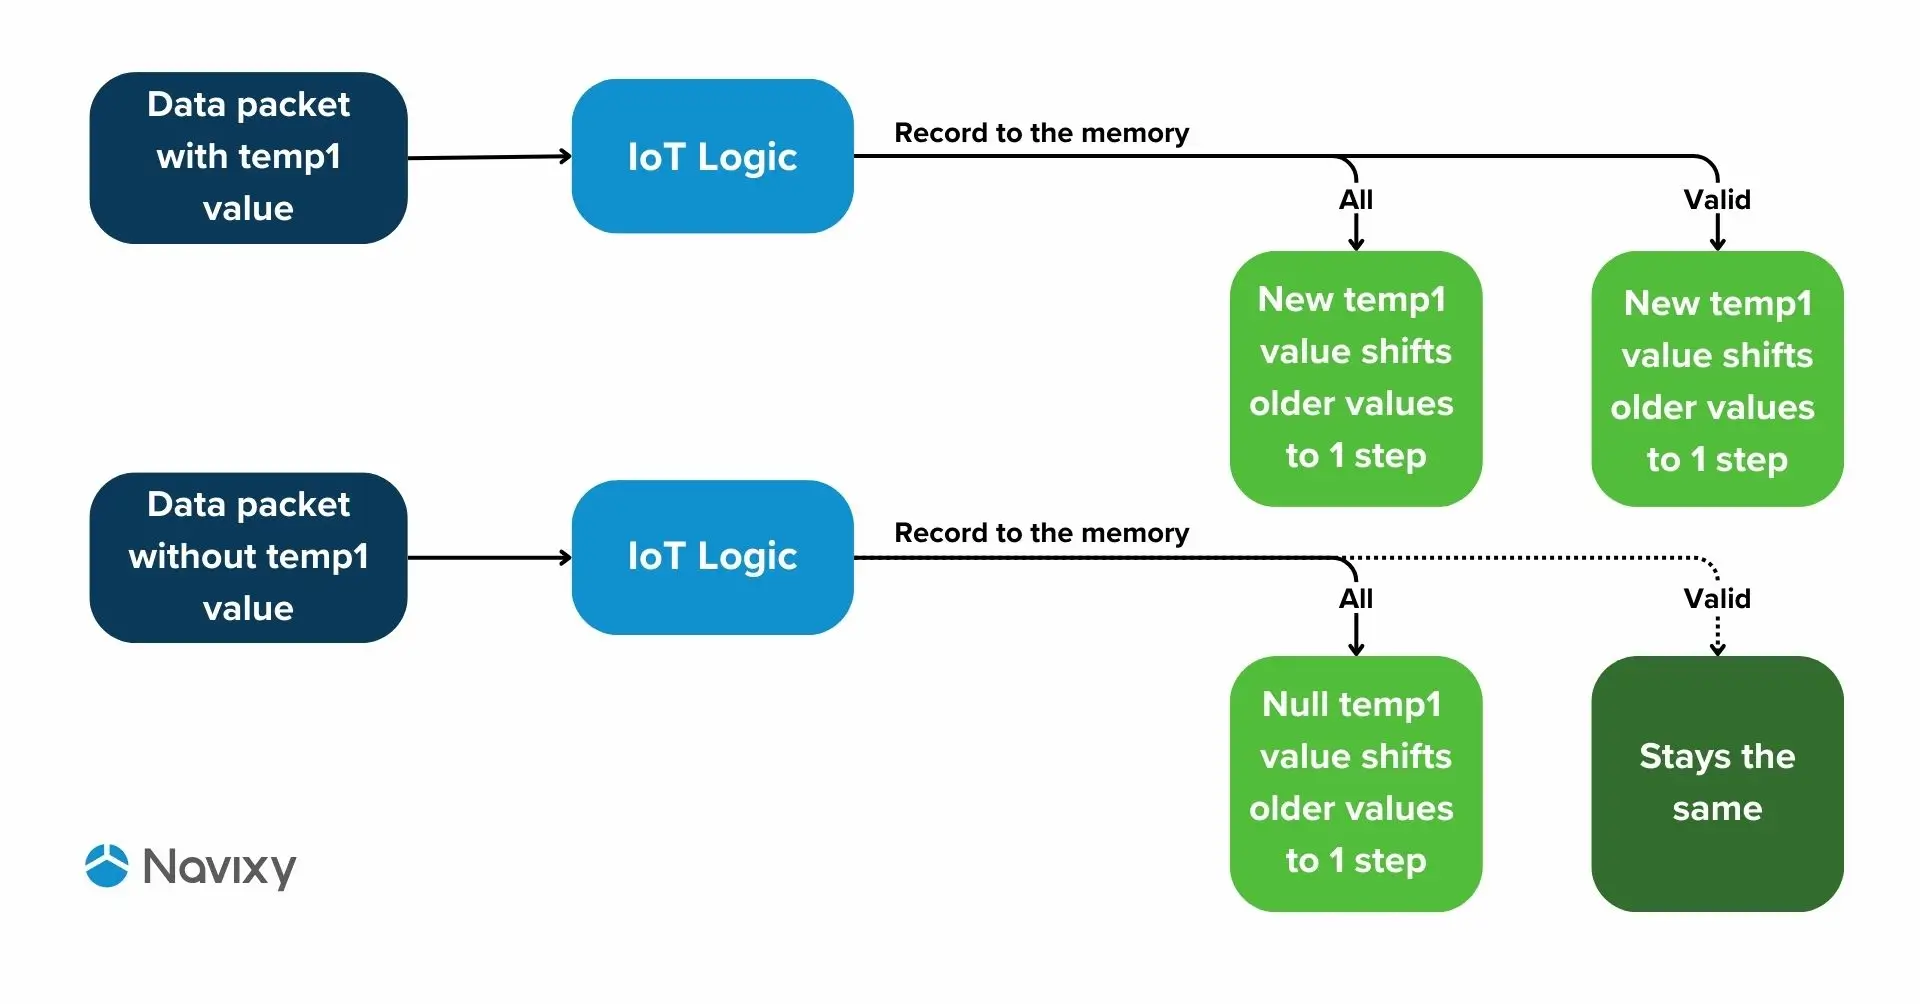
In the image above, you can see that if a value from the device comes with a data packet, it will be written to both storages, shifting the previous data. At the same time, their index will change to a higher one. If no value came with the data packet, the Null value will be written to the All storage, while the Valid storage will remain unchanged, since no valid value was received.
Using historical data in the IoT Logic product
We have looked at how data is stored on the product side. Now we will touch on how they are used in the product and how they can be viewed.
Below are the main ways to consume historical values of device parameters in the IoT Logic product:
- Initiate Attribute node – to calculate new values
- Logic node – for logical operations and if/else expressions
- Data Stream Analyzer – debugging tool for viewing, analysing and monitoring historical values
In the Initiate attribute node, we can calculate new values based on the received data, calculate average values and rename device parameters. An example of use can be seen in the screenshot below:
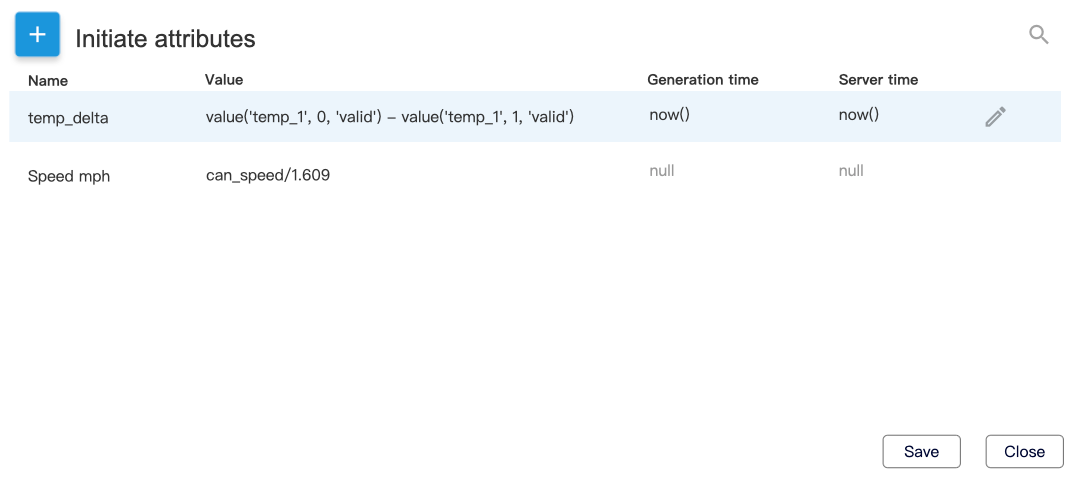
In the examples, we can see the calculation of the difference between the current and previous temperatures, as well as the translation of speed from km/h to m/h.
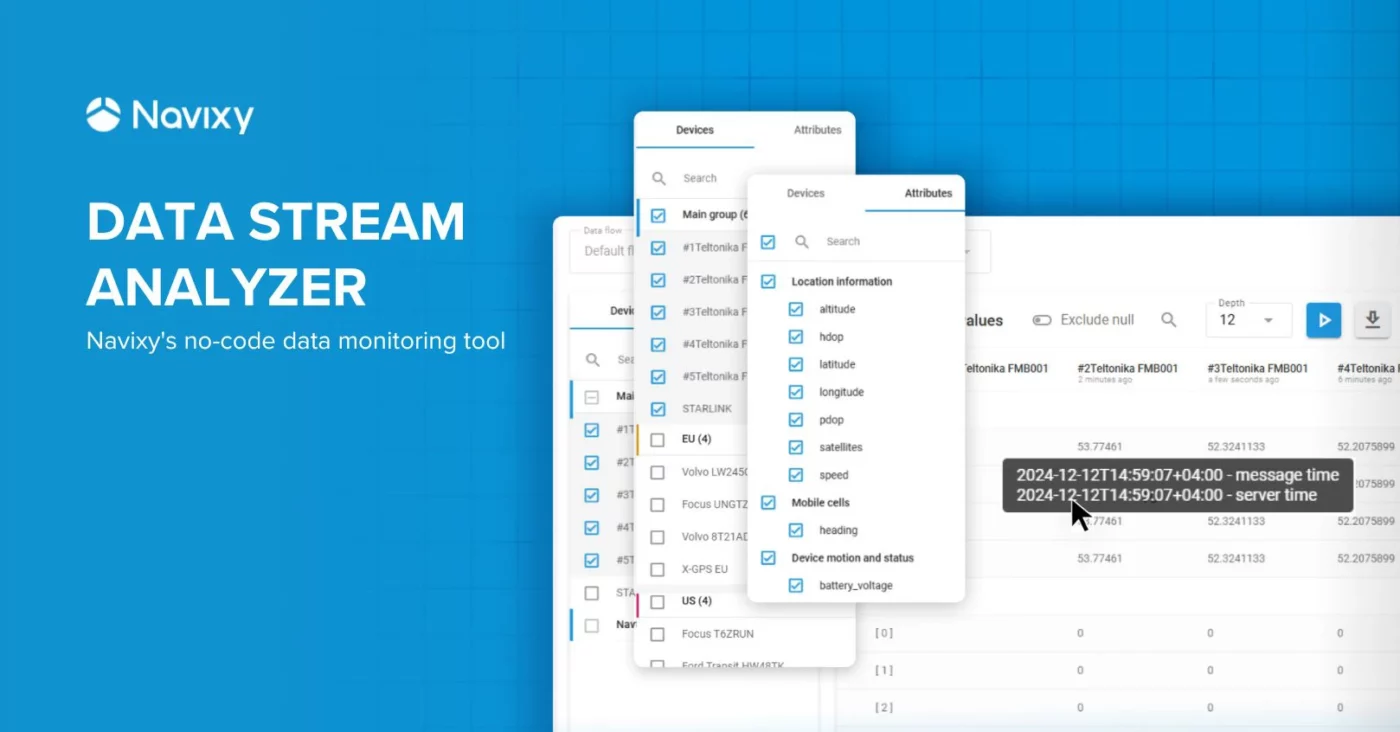
In the Data Stream Analyzer, you can view historical data in tabular form with real-time updates for several devices in bulk. The table in the Data Stream Analyzer looks as follows.
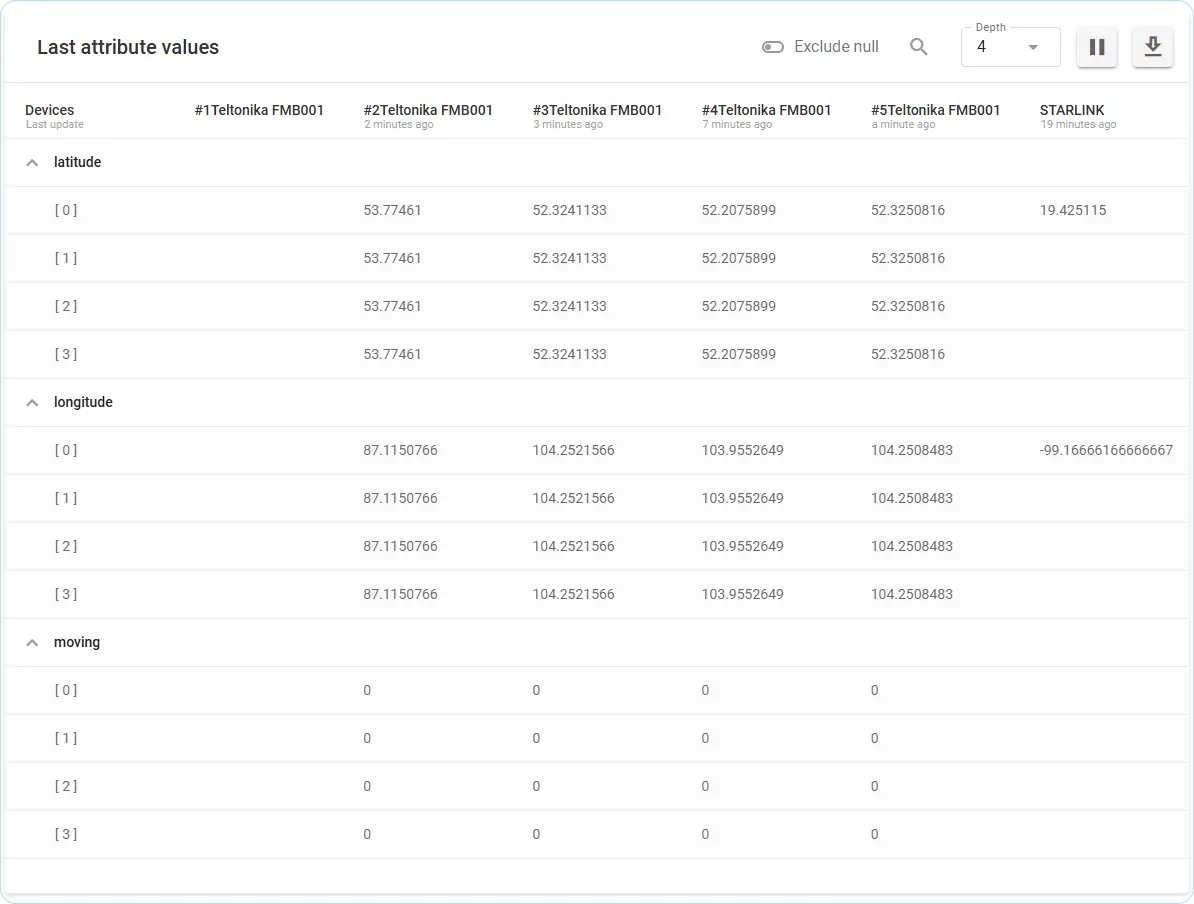
When you hover over a value, you will see a tooltip that shows the generation time on the device and the reception time on the server.
All values are arranged in one table and categorised, which is convenient for viewing and analysing the incoming values and attributes calculated in IoT Logic. Moreover, this data can be uploaded in JSON format for further use on a third-party server or application.
Also, if needed, you can change the number of displayed historical values for all parameters and use the specific value search to track a particular value in the table in real time. When a value is retrieved and displayed in the table, it will be highlighted in colour.
Common use cases for Navixy’s Data Stream Analyzer
From theory to practice, let’s take a quick look at a couple of common real-world applications of Data Stream Analyzer.
Fuel calibration and monitoring for fleet vehicles
Managing fuel costs is a critical challenge for fleet operators, and even minor discrepancies in fuel sensor data can lead to inefficiencies and financial losses. The Data Stream Analyzer addresses these issues in several ways.
- Fleet managers can create and fine-tune calibration settings for fuel sensors, ensuring accurate readings regardless of sensor quality or external factors.
- A deep dive into past data enables precise calibration over time, helping to improve long-term fuel monitoring accuracy and uncover recurring issues. This leads to better cost control and fleet efficiency.
For example, if a fuel sensor reports irregular values, the Data Stream Analyzer can highlight the discrepancies, allowing managers to recalibrate settings quickly and ensure that no litre of fuel goes unaccounted for.
Ensuring complete data from GPS trackers and vehicle sensors
IoT system integrators often encounter situations where some crucial data attributes (e.g., speed, location, or fuel level) are missing or delayed, compromising system performance. Let’s say, a GPS tracker stops reporting fuel level data intermittently At this point, the tool can help figure out whether the issue is related to the tracker’s configuration or connectivity with the server.
- Fleet operators and integrators can monitor incoming data streams for completeness, ensuring that all attributes are received and processed correctly.
- When irregularities occur, users can pause the data stream to inspect historical and real-time data, pinpointing exactly when and where transmission issues began.
- Whether the issue lies in hardware, firmware, or network latency, the Data Stream Analyzer helps identify the root cause, enabling quick resolutions.
Troubleshooting missing geolocation data
For logistics companies, consistent geolocation data is critical for efficient route planning, real-time tracking, and fleet management. Gaps in GPS updates can lead to delays and poorer operation. For example, certain vehicles in the fleet are updating their location every 30 seconds instead of the expected 10 seconds, and you want to know what’s the cause—tracker configuration or server-side processing issues. Data Stream Analyzer can help identify it.
- Users can inspect the raw data to identify gaps in attributes such as coordinates, speed, or timestamps, enabling quick detection of inconsistencies.
- Using null value filters, users can remove noise or incomplete data, focusing only on what matters to isolate the problem.
Conclusion: Making data management simple
As you can see, Data Stream Analyzer is a powerful data monitoring and debugging tool that can help you view, analyse and upload historical data for further processing and more in-depth analysis, thus expanding the already great capabilities of the IoT Logic product. It transforms how businesses manage telematics data, cutting downtime, improving accuracy, and speeding up troubleshooting, allowing for more control over your telematics operations.
It’s worth mentioning that we’re working on the IoT Logic product, always having our customers in mind. We strive to provide them with tools and solutions that give them the greatest flexibility to solve various cases. At the same time, we want to keep it simple, intuitive and visually appealing.
