- Businesses often struggle to derive insights from overwhelming IoT data streams due to a lack of efficient processing and analysis tools.
- Navixy's IoT Logic simplifies data management by offering a visual, no-code/low-code flow system and a powerful expression language.
- Users can transform, combine, and analyze raw data from multiple sources through customizable data pipelines and JEXL-based expressions without having advanced coding skills.
Telematics experts and integrators often face the challenge of deriving meaning from vast IoT data streams. Navixy's IoT Logic application addresses this challenge by combining a visual flow system with a powerful expression language, allowing the management of raw telematics data streams without coding.
The tool drastically facilitates data processing and analysis, whether you're working with GPS trackers, dash cams, or multiple IoT sensors. Let's explore how it works.
Why would you need IoT Logic?
Telematics systems produce enormous volumes of data, often overwhelming businesses as they try to extract actionable insights. This data overload might be a hurdle for companies that lack the tools or expertise to sift through and prioritize valuable information. With data pouring in from multiple IoT devices (like GPS trackers), converting raw data into useful insights becomes increasingly complex.
A recent industry survey illustrated these difficulties, with 32.7% of respondents reporting challenges in making their telematics data actionable for their business.
Another layer of difficulty comes from the nature of telematics data itself.
Basic data points from GPS trackers and other IoT devices, such as location or speed, might not be enough for complex operations or calculations that businesses might require. Companies must integrate this data with additional layers to derive the insights necessary for optimizing performance or reducing costs. Without the systems to process and interpret the data, businesses can find themselves drowning in information but starved of insights that make sense.
And here, Navixy’s IoT Logic comes to the scene.
IoT Logic flow chart: Architecting data pipelines
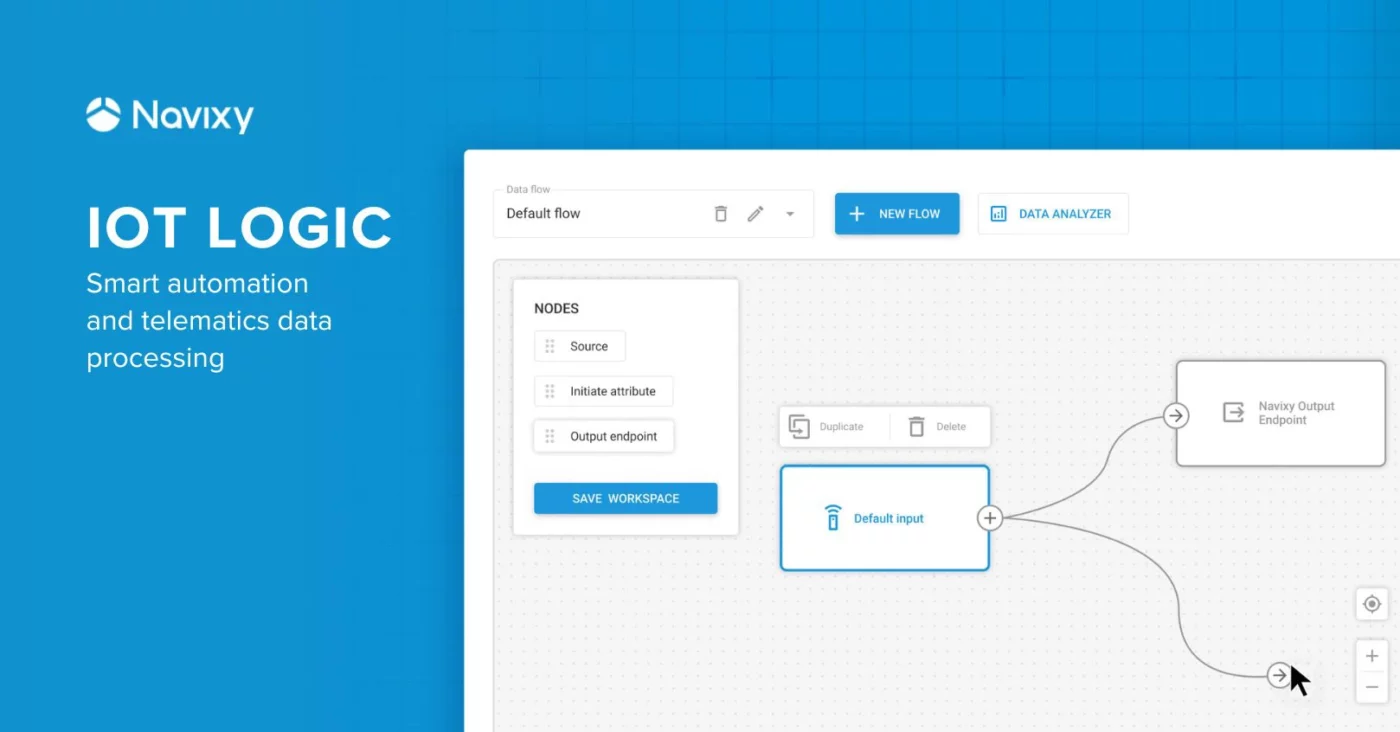
Navixy's IoT Logic has a powerful yet intuitive flow chart model for data transformation as its central part. This visual approach to data processing allows users to easily architect complex data pipelines, turning raw device data into more meaningful, structured information.
The flow chart consists of interconnected nodes, each representing a specific data operation or transformation. Today, we're zeroing in on the cornerstone of this system: the "Initiate attribute" node – a versatile tool that allows you to define and manipulate data attributes using a robust expression language.

With the “Initiate attribute” node, you can:
- Create new data entries on the fly;
- Transform existing data through custom formulas;
- Combine information from multiple sources.
As you'd expect from a robust data processing system, IoT Logic excels at handling simple transformations and intricate cascading calculations. By chaining these nodes together, you can break down complex data processing tasks into a series of manageable steps, making it possible to build sophisticated data pipelines using a visual, low-code approach.
Hands-on walkthrough: Building with 'Initiate attribute' nodes
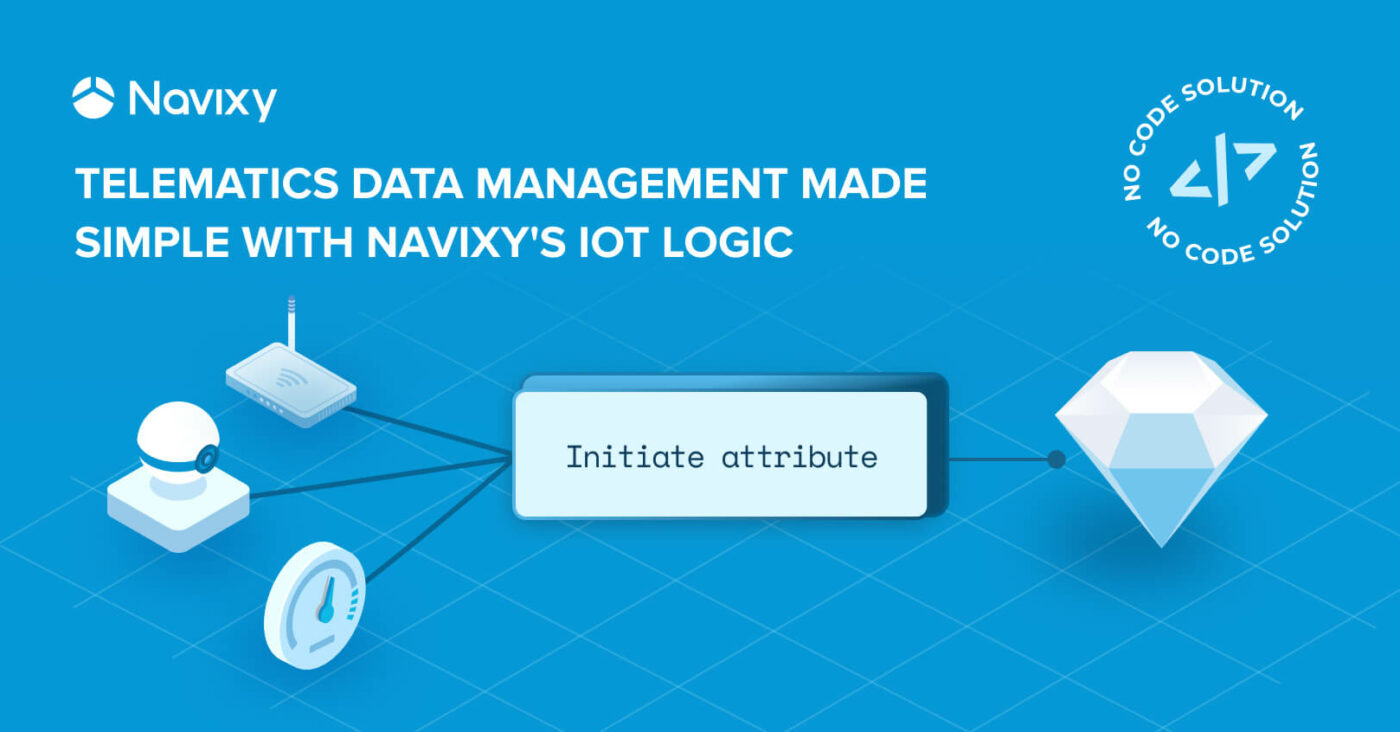
To make it even more clear, let's walk through the diagram below, demonstrating how easy it is to perform no-code/low-code data manipulation using our 'Initiate attribute' feature.
On the left, you see our data sources – GPS trackers and dash cams. These might be any devices integrated with Navixy, but for clarity we're talking about specific protocols like Queclink @Track for GPS and Jimi for dash cams.

Now, regardless of the data source, everything flows into our 'Initiate attribute' nodes, the true workhorses of our system. They allow you to create new data points, transform existing ones, or combine information from multiple sources – all without writing a single line of code.
One more crucial feature to note: these nodes can be chained together. This chaining allows you to break down complex data manipulations into a series of simple, manageable steps.
Lastly, let's look at the destination of this processed data. It can seamlessly flow into either Navixy's native apps or your own custom applications, giving you ultimate flexibility in how you use your transformed data.
JEXL: Powering the expression language
The expression language in IoT Logic is based on JEXL (Java Expression Language), a powerful tool that's particularly useful for non-professionals looking to implement low-code solutions. JEXL offers several benefits:
- Simplicity. It uses straightforward syntax that's easy to learn and read.
- Flexibility. JEXL can handle a wide range of operations, from basic arithmetic to complex logical expressions.
- Integration. It seamlessly integrates with Java objects, making it a natural fit for the Navixy platform.
For those new to coding, JEXL provides a gentle learning curve while offering the power to perform complex data manipulations. This makes it an ideal choice for IoT Logic, allowing users to create sophisticated data transformations without the need for full-fledged programming skills.
Leveraging historical data in expressions
The expression language in IoT Logic is designed for flexibility and power. A key feature is the ability to access historical data of all attributes available in the original (raw) data flow and new attributes created within the flow chart:
- Up to 12 historical values are available for each attribute
- Users can specify how to retrieve these values:
- By index (0 to 11, where 0 is the most recent)
- By validation flag:
- 'all': Includes all historical data, including null values
- 'valid': Excludes null values
Syntax for accessing historical values
To access historical data, use the following syntax:
value('parameter_name', index, 'validation_flag')
For example:
value('temperature', 0, 'valid'): Most recent valid temperature reading;value('fuel_level', 5, 'all'): 6th most recent fuel level reading, including null values.
Temporal context: Utilizing date and time information
Each historical value comes with associated date/time information:
genTime('parameter_name', index, 'validation_flag'): When the value was generated on the device;srvTime('parameter_name', index, 'validation_flag'): When the value was received by the server.
This temporal data allows for time-based analysis and calculations within your transformations.
Managing real-world sensor data streams
Let's take a closer look at how IoT Logic handles data streams from devices.
Imagine a constantly updating timeline of sensor readings. As new messages arrive, they populate our data frame with actual values or 'null' if no data is received. Here's the key: we maintain a historical record of up to 12 readings for each parameter.

Notice how in this example, we have gps_speed and cargo_temp. The cargo temperature shows an interesting pattern – see that 'null' value? This is where the expression language demonstrates its versatility. By using different validation flags, we can either include or exclude these null values in our calculations. For instance, value('cargo_temp', 1, 'all') would give us 'null', while value('cargo_temp', 1, 'valid') returns '4.6'. This flexibility allows you to handle missing data elegantly, ensuring your analyses and transformations are robust and accurate.
From theory to practice: Real-world applications
The true power of Navixy's IoT Logic becomes evident when applied to real-world scenarios, spanning from simple unit conversions to data synchronization, and advanced trend analysis. Let's explore some concrete examples that demonstrate how IoT Logic enhances the value of your IoT data across various use cases.
- Temperature conversion (Celsius to Fahrenheit):
(value('temp_celsius') * 9/5) + 32
This simple expression converts temperature readings from Celsius to Fahrenheit. - Creating meaningful features from CAN bus data:
value('can_seatbelt') == 1 ? "Driver belt fastened" : "Driver belt unfastened"
value('can_cruise_control') == 1 ? "Cruise control engaged" : "Cruise control disengaged"
These expressions transform binary CAN bus data into human-readable status information, useful for applications and reports. - Synchronizing sensor data:
value('fuel_level', 0, 'all') != null ? value('fuel_level', 0, 'valid') : value('fuel_level', 1, 'valid')
This expression ensures that every GPS point has a corresponding fuel level value, even when the fuel sensor reports less frequently than the GPS. - Calculating rate of change over time:
(value('speed', 0) - value('speed', 1)) / (srvTime('speed', 0) - srvTime('speed', 1)) * 1000
This calculates the rate of change in speed (acceleration) in units per second. - Creating moving averages:
(value('temperature', 0) + value('temperature', 1) + value('temperature', 2)) / 3
This computes a simple moving average of temperature over the last three readings.
Conclusion: Making telematics data management more accessible with IoT Logic
Wrapping it up, Navixy's IoT Logic brings telematics data processing to a new level, combining visual flow charts and historical data access to transform raw data into valuable insights. The Initiate attribute node, highlighted in this post, enhances the informational value of IoT data. This no-code/low-code approach not only makes complex data manipulation accessible to users with varying technical skills but also reduces the need for specialized developers, significantly cutting down on operational costs and accelerating decision-making.
By automating data processing and allowing businesses to create sophisticated data pipelines quickly, IoT Logic helps organizations save both time and money. Its scalability and integration capabilities further ensure that businesses can seamlessly adapt as their IoT data needs grow.
Aligning with Navixy's mission to democratize telematics, IoT Logic helps companies of all sizes to maximize the value of their location and vehicle data, fostering efficient, data-driven decision-making.


