Why temperature-controlled logistics needs event data, not just averages

AuthorAndrew M., VP of Data and Solutions
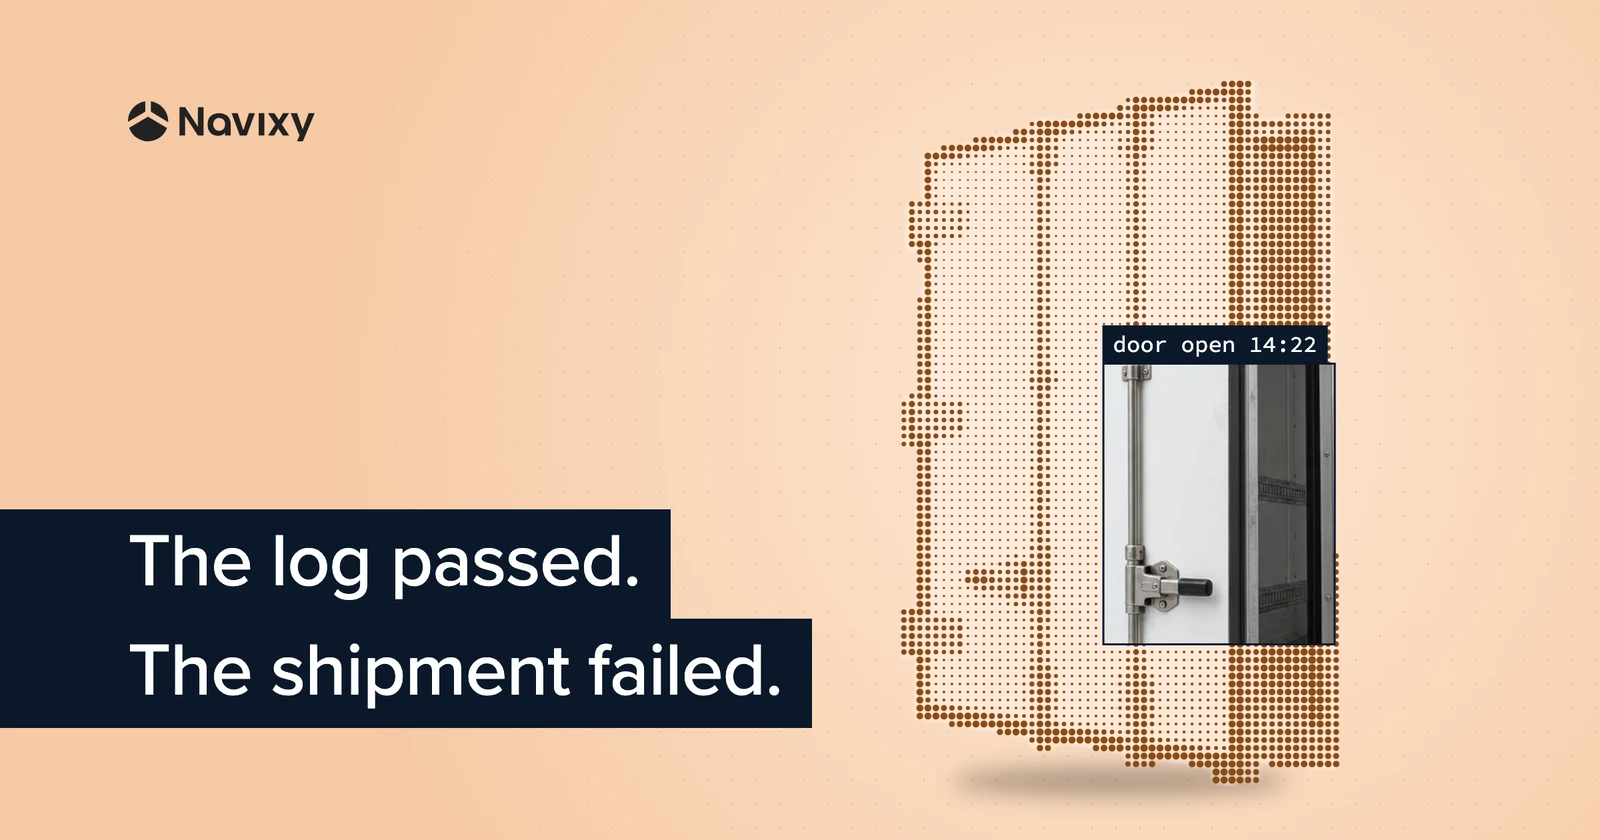
Temperature-controlled logistics runs on one assumption: a clean log means a safe shipment. It doesn't always. A pharmaceutical distributor's consignment gets rejected. The log looked clean: 18 hours at 3.2 °C. But the auditor found 20 minutes at the loading dock, door open, a spike standard trip reports never caught. Most systems show tracks and thresholds. Trips Intelli, a free open-source application from Navixy, rebuilds a trip like this one on a single timeline, with stops, door openings, and sensor readings in one place.
Often the data exists, but it is split across three tables at three resolutions, and nothing joins them to reconstruct that moment. TT Club's claims data points the same way. Over half of temperature-controlled incidents come from miscommunicated care instructions and wrong temperature settings, while equipment failure or damage accounts for about a quarter. In this case, the reefer held all night. The cargo was exposed during 22 minutes on the dock.
This post shows how an analytics layer can answer the auditor's question: What exactly happened at the loading dock at 14:22?
State changes are where temperature-sensitive shipments actually fail
WHO guidance on the storage and transport of time- and temperature-sensitive pharmaceutical products (TRS 961, Annex 9) addresses these points through requirements for loading bays, transport route qualification, and temperature monitoring in transit. In a refrigerated road journey, the cargo is most exposed at handling points:
- the initial pre-cooling period,
- loading,
- door openings during delivery,
- multi-stop dwell time,
- and customs or border holds.
These are not the parts of the trip where a temperature logger shines. They are often unannounced and easy to miss in averaged data, and that is exactly when the cold chain is most likely to break.
The regulatory consequence follows logically. EU Good Distribution Practice guidelines (2013/C 343/01) require temperature excursions during transport to be reported to the distributor and the recipient and investigated under a defined procedure. The distributor must also be able to show that the medicines were not exposed to conditions that could compromise their quality. Health Canada's GUI-0069 (Guidelines for environmental control of drugs during storage and transportation) sets similar expectations for drugs in transit. A passing hourly mean gives an investigator little to work with when the excursion lasted 22 minutes.
For fresh produce and food-grade cold chains the regulatory text differs, but the operational reality is identical: a consignment rejected at a distribution center because of temperature concerns will be investigated event by event, not average by average.
The temperature-controlled logistics integration problem
Here is the specific data problem. A modern telematics deployment typically produces three streams: a GPS position track, a temperature sensor log, and telemetry events such as ignition on/off and door open/close.
In most fleet systems, these streams live in separate tables or are queryable at different resolutions. Depending on device configuration, temperature readings and GPS positions are often recorded at different intervals. Door events are timestamped to the second but are often stored in a schema designed for real-time alerting, not for after-the-fact correlation.
The door-open event that caused the excursion is four rows away from the temperature reading that recorded it. Joining them requires knowing the trip boundaries, the geofence context of the stop, and the sensor channel identifiers that map to a specific cargo compartment. Most organizations either don't do this join at all, or hire an integrator to build it once for a single customer and never generalize it.
That is the gap. It is not a hardware problem. It is a data architecture problem.
Navixy IoT Query, a data analytics platform, exposes the full telemetry and business dataset as a direct PostgreSQL connection: tracking data, sensor readings, geofence events, custom states, and trip metadata in a schema you can query with standard SQL. IoT Query makes the join possible. Trips Intelli makes the investigation usable.
What Trips Intelli is
The application Trips Intelli covers the missing layer of trip-level event correlation as a comprehensive app for trips intelligence. It does not have its own data ingestion layer. It connects to the same PostgreSQL surface that any Navixy user with IoT Query access can query, and it runs a multi-stage processing pipeline against that data to produce trip-level analytics and compliance records.
The architecture choice matters for a builder: there is no proprietary API to negotiate, no intermediate data warehouse to maintain, and no re-ingestion pipeline to keep synchronized. The processing happens on top of data that already exists.
Five investigation questions, answered at the trip level
A compliance auditor reviewing a temperature-controlled shipment will ask a specific class of question.
Not "What was the average temperature?" but:
- Where was the vehicle when the sensor crossed threshold?
- Was the door open at that moment?
- Was this a scheduled stop or an unplanned deviation?
- Has this driver been running overtime shifts?
- What is the risk profile of this trip compared to others on the same corridor?
None of these questions can be answered from a temperature strip and a GPS log alone. Cold-chain compliance needs to be understood in the context of the entire trip, not as a separate temperature chart. Trips Intelli is built to bring route, temperature, door events, stops, and trip status into the same investigation context.
Trip segmentation with classified parking. The pipeline segments each position stream into trips and stops, classifies each stop as MOVING, PARKING, or ENGINE_ON_PARKING, and attaches duration and geofence context. A 22-minute stop at a distribution center loading dock is a distinct, labeled event, not a gap in the GPS track.
Route corridor compliance. Each trip is checked against a defined route corridor. Deviations are classified by type: off-route, unauthorized stop, with the segment and timestamp of the departure. They can also be graded by severity, helping analysts distinguish a minor corridor departure from an event that requires immediate investigation. A driver who took an unplanned detour through an unrefrigerated warehouse yard is a different case from a driver who stopped at a scheduled cross-dock.
Sensor threshold monitoring in geofence context. Temperature, fuel level, humidity, or any sensor available in the IoT Query schema can be monitored against configurable min/max thresholds. The alert includes the sensor reading, the timestamp, and the geofence the vehicle was inside at the time. This means you can answer "Did the excursion happen during loading at Origin Warehouse B, or during transit?" with a single query rather than a manual join.
Door-state correlation with location and temperature. Door-open events are correlated with the vehicle's position and temperature reading at the same timestamp. Instead of reviewing separate charts, an investigator can follow a multilayer timeline that combines temperature, door state, route position, and trip status in one view. You can see, for example, that the temperature rose from 3 °C to 11 °C during a 14-minute door-open event at coordinates [x, y], while the vehicle was outside its expected route corridor. That is the kind of sequence a regulatory investigation needs to reconstruct.
ML anomaly scoring with plain-text explanation. Each trip receives a risk score from an IsolationForest model trained on the fleet's own trip history. Anomalous trips surface with a plain-text explanation: "Out-of-shift / Night-time," "Unusual duration for this corridor," or "Sensor deviation pattern inconsistent with route." An analyst can prioritize investigations without reading every raw record. The score is a probabilistic indicator; a flagged trip warrants review, not an automatic adverse finding.
Learn more about the different levels of trip reporting in Navixy.
The view that turns raw telemetry into an investigation record
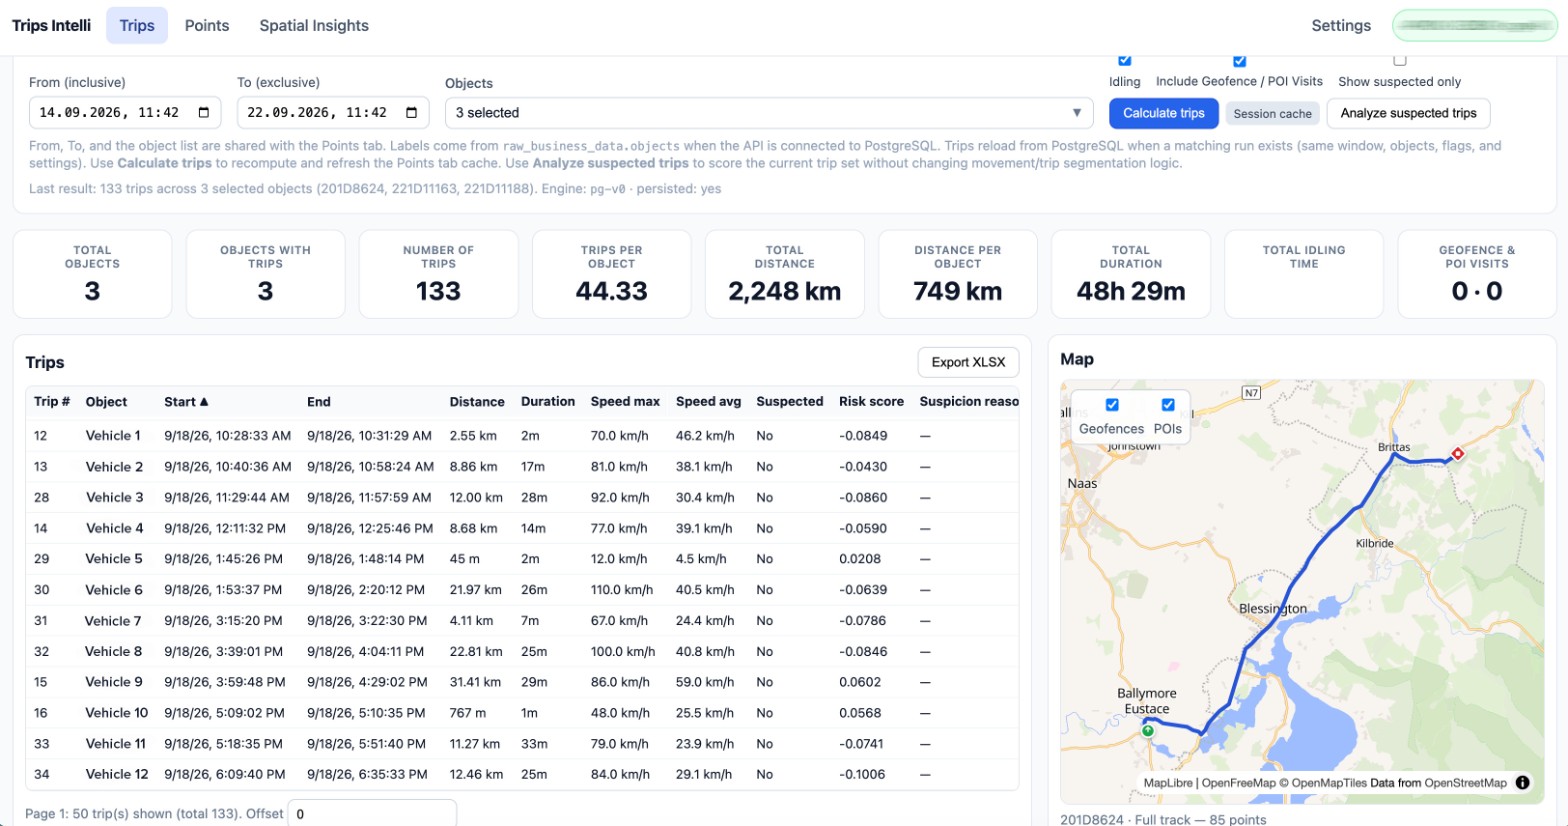
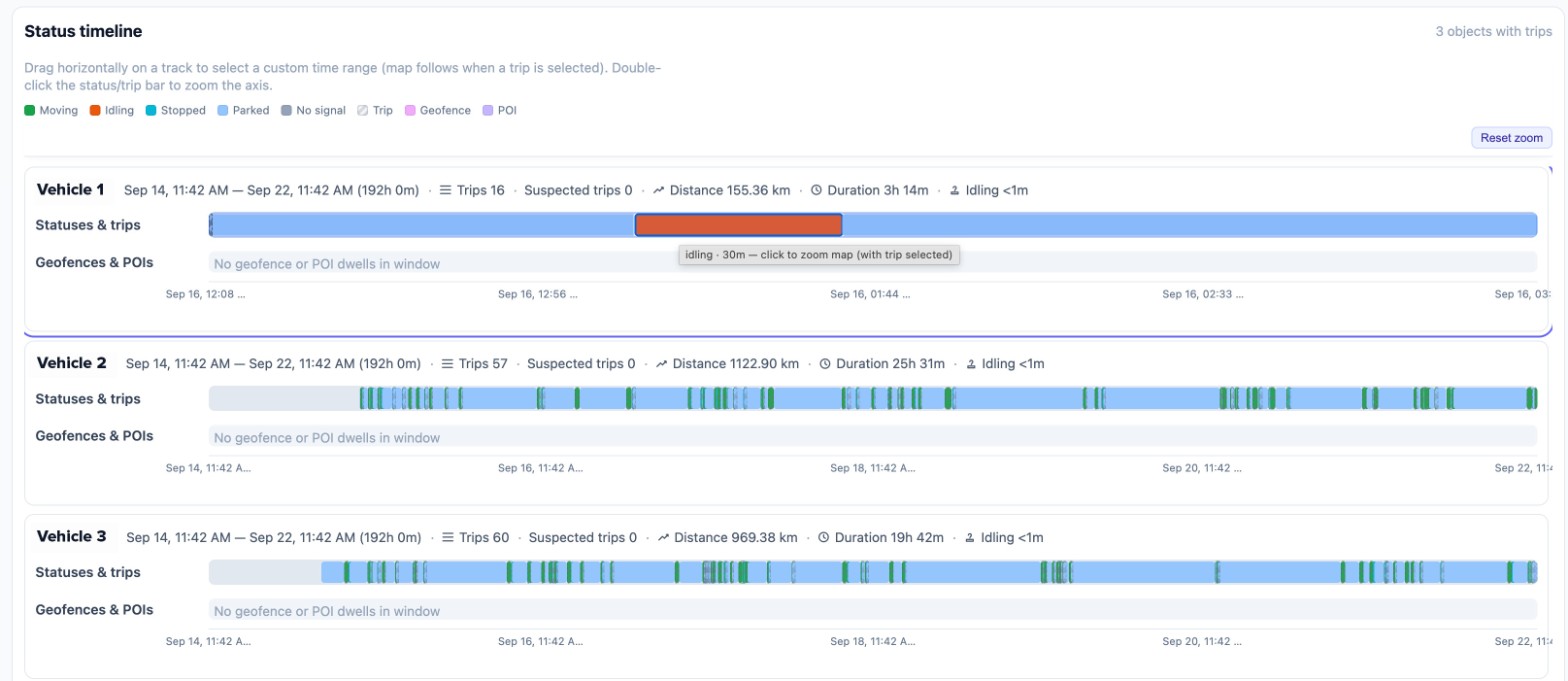
The application's main view is a trip table with a filter panel, an embedded map, and a status timeline. A compliance manager reviewing a flagged consignment can filter by sensor excursion, door event, or route deviation, select the trip, and see the full reconstructed timeline in a single view: GPS position, temperature channel, door state, and annotated event markers. Export to XLSX is one click.
This is the interface the person filing a regulatory response or negotiating a carrier claim actually uses. The developer who built it works at the query layer; the compliance manager who uses it works at the event layer. Both are looking at the same data.
Outcomes by role: what actually changes
Trips Intelli produces one trip-level record, correlating GPS, sensor, and event data into a single view. What changes is the part of the record each role reads.
For the compliance manager: a temperature deviation can be traced to the specific loading or door event that caused it, with timestamp, location, and duration. EU GDP and Health Canada GUI-0069 require exactly this before a disposition decision. The record was previously assembled manually from three systems; now it is one filtered view.
For the dispatcher: out-of-shift trips, overtime drivers, and off-corridor routes surface on the same table as temperature excursions. A driver running a night-time shift on a pharmaceutical delivery corridor and a driver with an unauthorized stop at a convenience store are both visible without pulling separate reports from a separate system.
For the fleet manager: the ML anomaly scores make the weekly review tractable. A fleet of 200 vehicles generates 1,400 trips per week. Reading every record is not an option. The top 12 by risk score, reviewed on Monday morning, captures the incidents that need attention, including the ones where the temperature log would have looked fine.
For the system integrator building on the stack: the IoT Query schema it queries is the same schema available to any developer who builds on top of Navixy. Adding a new sensor channel, a regulatory-specific threshold, or a customer-specific route corridor is a configuration change and, in some cases, a SQL modification.
Trips Intelli produces the record and the risk classification. It does not certify compliance, guarantee the acceptability of a shipment, or replace the disposition decision that belongs to a qualified person under applicable regulations.
Getting started with Trips Intelli: the schema is already there
IoT Query is the PostgreSQL connection surface Trips Intelli queries. If the client's temperature-controlled logistics operation already runs on Navixy fleet data (GPS positions, sensor readings, geofence events), the schema is already there. You do not need to build an ingestion layer.
This is exactly the kind of problem your own clients are already running into: a shipment rejected on paper-thin evidence, a compliance team asking questions the fleet data can't yet answer. Trips Intelli gives you a ready answer -- a solution you can put in front of any client moving temperature-sensitive cargo, without building the event-correlation logic yourself.
It's one more thing you can offer a client without adding engineering work.
On this page
- State changes are where temperature-sensitive shipments actually fail
- The temperature-controlled logistics integration problem
- What Trips Intelli is
- Five investigation questions, answered at the trip level
- The view that turns raw telemetry into an investigation record
- Outcomes by role: what actually changes
- Getting started with Trips Intelli: the schema is already there