> For the complete documentation index, see [llms.txt](https://navixy.com/docs/llms.txt). Markdown versions of documentation pages are available by appending `.md` to page URLs; this page is available as [Markdown](https://navixy.com/docs/user/guide/account/iot-logic/nodes/data-source-node.md).
# Data Source
Data Source node is the IoT Logic entry point for device telemetry. It receives data via TCP, UDP, HTTP, or MQTT, decodes it, and passes it to downstream nodes. It can also enrich an already-connected
## Technical overview and capabilities
{% columns %}
{% column %}
**Data Source** node is an entry point for telemetry data from IoT devices and OEM platforms in the IoT Logic system. It functions as a universal translator, receiving data via TCP/UDP/HTTP protocols on network interfaces and through MQTT queues, then decoding incoming data streams according to the selected protocol. The node transforms device messages into a standardized format that can be further processed in your flow.
{% endcolumn %}
{% column %}
{% endcolumn %}
{% endcolumns %}
Beyond receiving telemetry, a **Data Source** node can also enrich a device you've already added to it. An external system, such as a separate telematics platform that doesn't send data to Navixy by default, pushes extra attributes to the device's stream. Sometimes that external platform is the device manufacturer's own. Rather than migrating the device onto Navixy's native ingestion, the **Software** tab keeps it registered as-is. It continuously enriches the device's stream with data from that other platform, so both streams run in parallel. See [How pushed data is handled](#how-pushed-data-is-handled) for the mechanics, and [Configuration options](#configuration-options) to set it up.
### Flow architecture integration
**Data Source node** functions as the entry point for data in an IoT Logic flow. A single flow can contain multiple source nodes, each with independent configurations. This architecture enables:
* Initial data acquisition from multiple device types and protocol formats
* Standardized data transformation from various manufacturers into unified formats
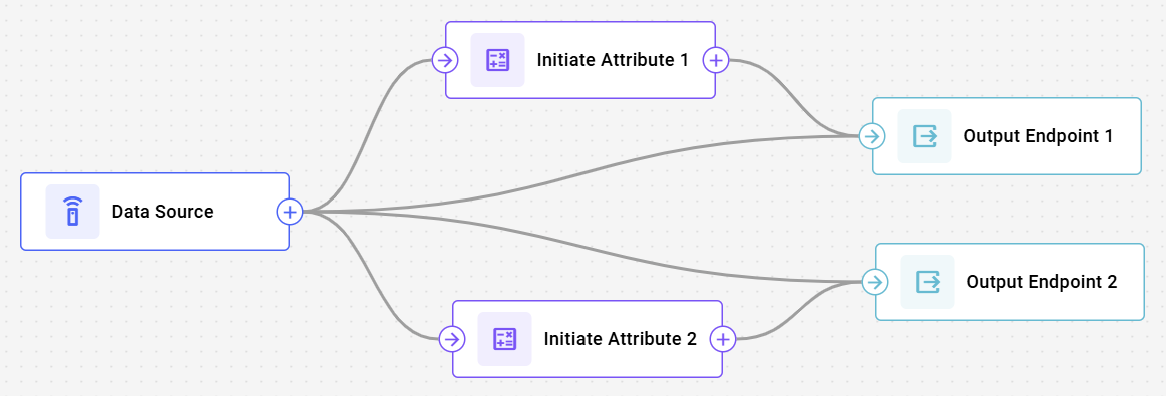
* Parallel processing paths by connecting one data source to multiple downstream nodes
* Selective device filtering to include only relevant data sources in your flow
* Stream enrichment for already-connected devices, using attributes pushed from an external system over HTTP
### Node capabilities
The **Data Source node** by itself offers:
* **Protocol diversity**: Supports multiple device manufacturers, including Teltonika, Queclink, Suntech, Jimi, and others, through inherited Navixy parsers and decoders
* **Transport flexibility**: Accommodates TCP, UDP, HTTP protocols and MQTT broker connections
* **Unified data transformation**: Converts device-specific messages to standardized format for consistent processing
* **Device filtering**: Provides filtering capabilities to select specific models or protocols
* **Real-time processing**: Handles incoming telemetry data streams in real-time for immediate processing
* **HTTP push enrichment**: Merges attributes pushed from an external system into the stream of a device already selected in this node. HTTP is the only supported push type today, with the architecture designed for more in the future
## Configuration options
{% columns %}
{% column width="58.333333333333336%" valign="middle" %}
Configuring a **Data Source** node determines which devices send data into your flow and, optionally, how an external system can enrich those devices with pushed data.
The configuration dialog is organized into two tabs:
* **Devices**: selects which devices send telemetry into the flow. Required, and works exactly as before.
* **Software**: configures HTTP push enrichment for the devices you selected in the Devices tab. Optional, and depends on that selection.
{% endcolumn %}
{% column width="41.666666666666664%" %}
{% endcolumn %}
{% endcolumns %}
{% hint style="info" %}
The **Software** tab depends on the **Devices** tab. Its **Source device** picker only lists devices already selected in **Devices**, and shows no data available until you select at least one there.
{% endhint %}
Let's see what elements this node uses and what you can configure when working with it:
### Configuration steps
{% stepper %}
{% step %}
#### Specify node name
Enter a descriptive name for this data source:
* Use a name that helps you identify the manufacturer, models, or other relevant information.
* This name will be displayed in the flow diagram for easy identification.
{% endstep %}
{% step %}
#### Select sources
From the filtered list, select the devices to include. Only devices registered in your Navixy user account are available for selection. This selection is also the prerequisite for the optional **Software** tab, which can only map devices selected here.
{% endstep %}
{% step %}
#### Save the node configuration
Click **Apply changes** to complete the node creation.
{% endstep %}
{% step %}
#### Configure HTTP push enrichment (optional)
Switch to the **Software** tab to enrich the devices you selected in Devices with data pushed from an external system. This step is optional. See [Configuring HTTP push enrichment](#configuring-http-push-enrichment) for the full setup.
{% endstep %}
{% endstepper %}
{% hint style="info" %}
If you change the manufacturer or model settings after selecting devices, Navixy notifies you if any selected devices don't match the new parameters but doesn't automatically remove them from your selection.
{% endhint %}
### Configuring HTTP push enrichment
HTTP push enrichment lets an external system add attributes to a device already selected in this node's **Devices** tab, by pushing data to a generated URL. It's optional, and requires at least one device selected under [Configuration steps](#configuration-steps) first.
This is useful when a device already reports to a separate system that doesn't feed Navixy by default, for example a battery management platform tracking the same vehicle's state of charge. Instead of migrating the device onto Navixy's native ingestion, you can keep it registered as-is and have that other platform push its readings here. A push with `vehicle_id: "truck_12"`, `bms_battery_soc: 76`, and `bms_battery_temp: 34.2` adds `bms_battery_soc` and `bms_battery_temp` as new attributes on the mapped device, alongside its native GPS telemetry.
{% stepper %}
{% step %}
#### Set connector type
Switch to the **Software** tab and set **Connector Type** to **HTTP**, currently the only option.
{% endstep %}
{% step %}
#### Save the flow and copy the generated URL
Save the entire flow, not just this node. The **URL** field only generates a value once the flow is saved with **Connector Type** set. Until then, it shows a placeholder prompting you to save the flow. Once the URL appears, click the copy icon next to it, disabled only while the field is empty.
{% endstep %}
{% step %}
#### Authenticate the external system
Give the external system a valid [Navixy API key](/docs/user/guide/account/api-keys.md), and configure it to send `Authorization: NVX ` with every push request, alongside the URL. A push without this header fails, so both the URL and the header are required before data can arrive.
{% endstep %}
{% step %}
#### Define primary key and mappings
Enter a **Primary key**: the name of the field the external system uses to identify which device a pushed record belongs to. It accepts up to 64 characters, letters, digits, and underscores only.
Add one **Mappings** row per device to enrich. For each row, select the **Source device**, limited to devices already selected in Devices, and enter the **Key value** that identifies that device in inbound pushes. This field stores up to 255 characters, but the push endpoint itself accepts only up to 100 characters per field, so keep the value well under 100 characters in practice.
{% hint style="warning" %}
Both Primary key and Key value accept only letters, digits, and underscores, no hyphens or other punctuation. The push endpoint's general field validation is more permissive and accepts hyphens in any field without complaint, but a hyphenated value can never match a stored Key value, so pushes using one are silently discarded exactly as if the value didn't match. If your external system's identifiers use hyphens (for example `truck-12`), translate them, for example to `truck_12`, before pushing.
{% endhint %}
{% endstep %}
{% step %}
#### Apply and save
Click **Apply changes**, then save the flow again if you configured the Software tab after the initial save.
{% endstep %}
{% endstepper %}
### Data processing specifics
**Data source node** inherits all parsers and decoders from Navixy, providing compatibility with a wide range of IoT devices. When data arrives at this node, it goes through the following process:
1. The incoming data stream is received through the specified transport protocol
2. The data is passed to the appropriate protocol decoder based on your configuration
3. Device messages are transformed into a standardized format that IoT Logic can process
4. The unified data is passed to the next node in your flow
This standardization process enables you to build consistent processing flows regardless of the original data format from various device manufacturers.
### How pushed data is handled
Navixy matches each inbound push by its primary key value against the node's configured **Mappings**, then merges the remaining fields into the mapped device's data stream as attributes: new if the field name is new, or written into that attribute's existing history if the name matches one that already exists, whether reported natively by the device or pushed by another flow's connector. They don't affect location or other telemetry. The field named in **Primary key**, along with `flow_id` and `node_id`, is used for routing and never becomes an attribute itself. A request can end up in one of three states:
| Outcome | HTTP response | Data merged? |
| ----------------------------------------- | -------------------- | -------------------------------------------------------------------------------------------------------------------- |
| Primary key value matches a mapping | 200, `success: true` | Yes. Remaining fields merge as attributes, new if the name is new, existing history if it matches one already in use |
| Primary key value matches no mapping | 200, `success: true` | No. Discarded silently |
| Missing or invalid `Authorization` header | 400 error | No. Rejected before Navixy checks the primary key |
{% hint style="info" %}
A 200 response only confirms Navixy accepted the request, not that the data merged. A mismatched primary key value is discarded silently, with no error to signal it. If you're unsure a push was matched, check the mapped device's attributes in [Data Stream Analyzer](/docs/user/guide/account/iot-logic/data-stream-analyzer.md) rather than relying on the response.
{% endhint %}
{% hint style="warning" %}
A pushed field name shares one namespace with the device's own native attributes, and with names pushed by another flow's connector enriching the same device. If the name matches one already in use, whether native to the device or pushed by another flow, the push overwrites that attribute's existing history instead of creating a separate one.
Sensors, reports, and alerts read the merged value as a real reading, so a colliding name can produce false data downstream. For example, a pushed field named `fuel_level` that matches a device's native fuel attribute would inject a false reading, producing false fuel-drop or refuel events in reports.
To avoid this, prefix pushed field names so they can't collide with a device's native attributes or another flow's pushed names, for example `bms_battery_soc` instead of `battery_soc`.
System message fields such as `speed`, `latitude`, `longitude`, `heading`, `satellites`, and `hdop` can't be overwritten this way. Pushes only ever create or update attributes, never message-level telemetry. A pushed field using one of those names still appears under that name in [Data Stream Analyzer](/docs/user/guide/account/iot-logic/data-stream-analyzer.md), separate from the device's real telemetry.
{% endhint %}
A merged attribute lands as a point-in-time entry in the device's attribute history, not a sticky current value. If the device reports its own telemetry much more often than the external system pushes updates, the device's own packets can advance the attribute's history past the pushed value within seconds, even though the merge succeeded.
{% hint style="info" %}
This is an expected consequence of two data streams running at different speeds, not a defect. Reference the attribute downstream as `value('attribute_name', 0, 'valid')` instead of its bare name. `'valid'` walks back through the attribute's history to the last non-null reading, so downstream nodes get the pushed value regardless of timing. See [Missing values and null routing](/docs/user/guide/account/iot-logic/nodes/logic-node/logic-node-expressions-and-syntax.md#missing-values-and-null-routing) for how `'valid'` compares to `'all'` in a Logic node condition.
{% endhint %}
The push endpoint accepts up to 1 request per second per API key, with a burst size of 1. Pace the external system's requests accordingly.
## Frequently asked questions
#### Can I use multiple Data Source nodes in one flow?
Yes, you can use several **Data source nodes** in one workspace. This is useful when you need to process data from different types of devices in different ways or want to merge several data streams after specific transformations.
#### What happens if a device is already used in another flow?
A device can belong to multiple flows at the same time. If you add a device that is already used in another flow, both flows process its data simultaneously and results are merged to avoid data loss. Being assigned to another flow isn't a restriction. If two flows' connectors push the same attribute name to that device, though, they don't merge harmlessly. One push's history overwrites the other's. See [How pushed data is handled](#how-pushed-data-is-handled) to avoid colliding names.
#### Are all my Navixy devices automatically available in IoT Logic?
Yes, all devices from your Navixy user account can be used in IoT Logic processing. This includes GPS devices, OEM platforms, MQTT devices and gateways, and MQTT/Kafka connectors. A device already selected in a **Data Source** node can also be enriched with attributes pushed from an external system over HTTP, through the node's **Software** tab.
#### How do I know which manufacturer to select for my devices?
The protocol should match the communication protocol used by your device manufacturer. Most devices use a protocol associated with their manufacturer (e.g., Teltonika devices use the Teltonika protocol). Check your device documentation or consult with your device provider if you're unsure.
#### Can I connect a Data Source node to multiple downstream nodes?
Yes, you can connect a **Data Source node** to multiple processing nodes to create parallel processing paths. This allows you to apply different transformations to the same data stream. Here’s an example:
#### Can I bring in data from a system that isn't a Navixy device?
Yes, through the **Software** tab, but only to enrich a device you've already added in the **Devices** tab. It isn't a way to create a flow with no devices in it.
#### The system I'm pushing from reports less often than my device, will the pushed data get lost?
No, but a pushed attribute can stop being the current value quickly if the device reports much more often, since both contributors share the same rolling history. Reference the attribute downstream as `value('attribute_name', 0, 'valid')` instead of its bare name to reliably get the last real reading regardless of timing. This is an expected consequence of two streams running at different speeds, not a defect. See [How pushed data is handled](#how-pushed-data-is-handled) and [Missing values and null routing](/docs/user/guide/account/iot-logic/nodes/logic-node/logic-node-expressions-and-syntax.md#missing-values-and-null-routing) for the `'valid'` vs `'all'` distinction in a Logic node condition.
#### I pushed data but it's not showing up, what's wrong?
Check these in order:
1. Confirm the request included a valid `Authorization: NVX ` header. A missing or invalid header fails loudly with an HTTP 400 error.
2. Confirm the pushed field name matches the node's **Primary key** setting exactly, and its value matches one of the configured **Mappings** exactly, letters, digits, and underscores only. A hyphenated value is the most common cause: it passes the push endpoint's own validation without error, but can never match a stored Key value, so the request still returns success while nothing merges.
3. Check the attribute's history in Data Stream Analyzer, not just its current value. A device that reports its own telemetry often can scroll a merged value out of the current slot within seconds, even though the merge succeeded.
#### I pushed a field and the device's own readings look wrong
The pushed field's name likely matched a native attribute the device already reports, or one pushed by another flow's connector, and overwrote its history instead of creating a separate attribute. Rename the pushed field with a distinct prefix, then check the attribute's history in [Data Stream Analyzer](/docs/user/guide/account/iot-logic/data-stream-analyzer.md) to confirm the pushed and native values are no longer mixed.
---
# Agent Instructions
This documentation is published with GitBook. GitBook is the documentation platform designed so that both humans and AI agents can read, navigate, and reason over technical content effectively. Learn more at gitbook.com.
## Querying This Documentation
If you need additional information that is not directly available in this page, you can query the documentation by asking a question.
Perform an HTTP GET request on the following URL with the `ask` and `goal` query parameters:
```
GET https://navixy.com/docs/user/guide/account/iot-logic/nodes/data-source-node.md?ask=&goal=
```
`ask` is the immediate question: it should be specific, self-contained, and written in natural language.
`goal` is what the user is ultimately trying to achieve, the reason they need the answer. Sharing it helps GitBook give you a better, more relevant answer. A goal is most helpful when it describes the outcome the user wants rather than restating the question. For example, with `ask=how do I create an API token`, a goal like `automate deployments from our CI pipeline` lets GitBook tailor the answer to that use case.
The response will contain a direct answer to the question and relevant excerpts and sources from the documentation.
Use this mechanism when the answer is not explicitly present in the current page, you need clarification or additional context, or you want to retrieve related documentation sections.

.png?alt=media)