> For the complete documentation index, see [llms.txt](https://navixy.com/docs/llms.txt). Markdown versions of documentation pages are available by appending `.md` to page URLs; this page is available as [Markdown](https://navixy.com/docs/user/guide/fleet-management/eco-driving.md).
# Eco Driving
Score driver safety from 0 to 100 using penalties for speeding, harsh driving, and excessive idling. Configure thresholds and export or schedule PDF reports.
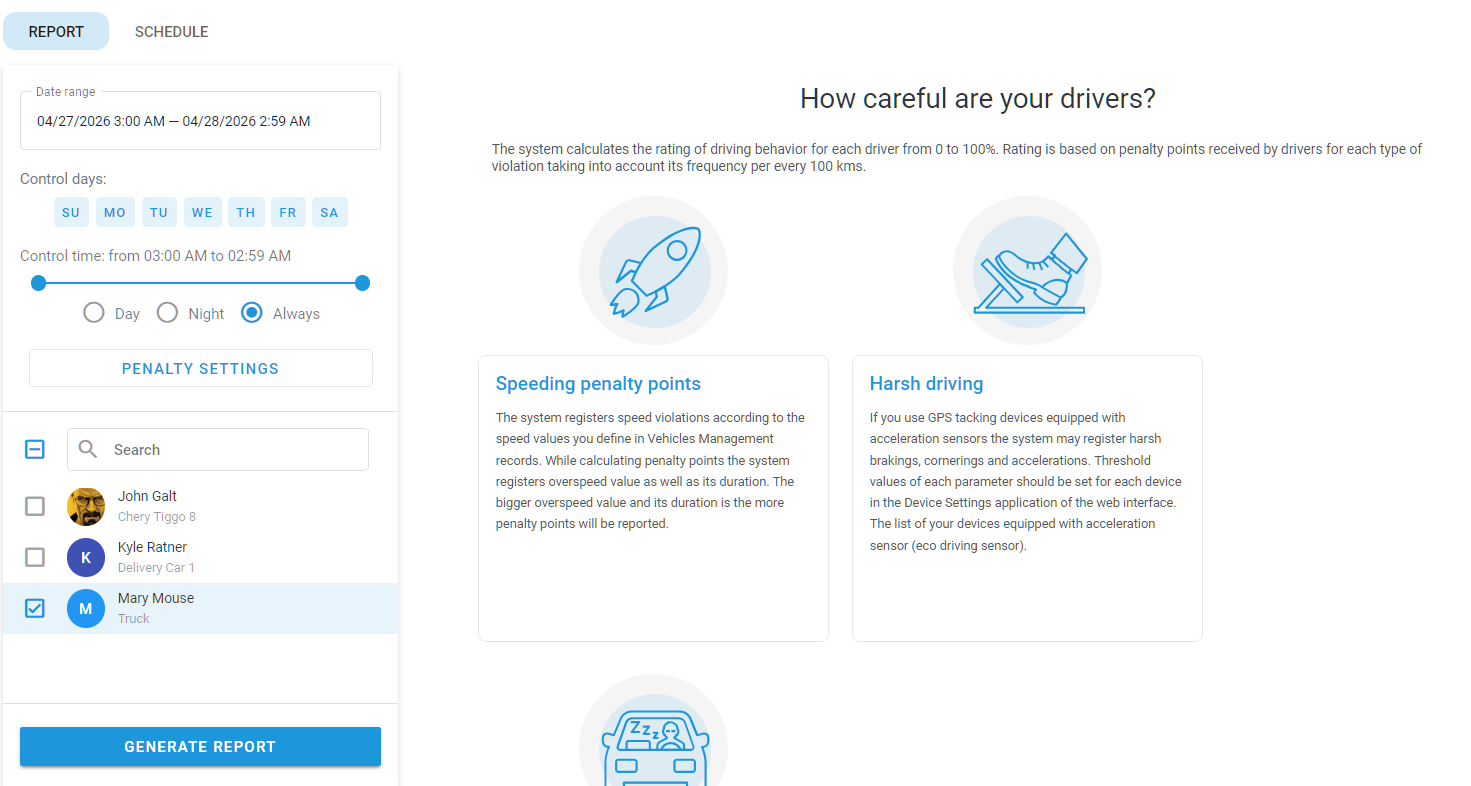
The **Eco Driving** report scores how safely and efficiently your drivers behave on the road. Each driver gets a rating from 0 to 100, calculated from the penalty points given for speeding, harsh driving, and excessive idling. The score is normalized by distance traveled, so it stays fair regardless of how much each driver drove during the period.
To open the report, go to the **Fleet Management** app and select the **Eco Driving** tab.
Eco Driving page
## Eco Driving report use cases
**Eco Driving** is particularly useful for companies that need to monitor driver behavior closely, such as those in passenger transport, hazardous material transport, or emergency services. By analyzing this report, organizations can extend vehicle lifespans, reduce the likelihood of accidents, and ensure that vehicles are used efficiently and responsibly.
It's an essential feature for any fleet manager looking to maintain high standards of driver safety, efficiency, and regulatory compliance.
## How Eco Driving rating is calculated
The Navixy platform records every speeding, harsh driving, and excessive idling event during the report period, multiplies each one by the penalty you have configured, sums them up, and then divides the total by the distance the vehicle actually drove.
In simple terms, `rating = 100 − (penalty points per 100 km)`, between 0 and 100.
So a driver who drove a long distance with very few violations scores close to 100, while a driver who racks up a lot of penalty points relative to their mileage scores closer to 0. The same number is also displayed as a 1-to-5 star rating next to the score.
{% hint style="info" %}
To receive a rating, the driver of vehicle needs at least 1 km of recorded movement during the period. Otherwise, the message "No movements found for the specified period" is displayed.
{% endhint %}
## What counts as a violation
The report tracks three categories of violations. You decide how each one is penalized in **Penalty settings**.
### Speeding
A speeding violation is recorded when the driver's speed exceeds the applicable limit for longer than the **Speeding duration** you set. Brief excursions over the limit are ignored, and only sustained speeding counts.
The **Use speed limit** setting determines where the limit comes from. Select one of the following options:
* **Specified**: Enter a single speed value that applies to every vehicle in the report.
* **From vehicle parameters**: Use the **Permitted speed** value from each vehicle's profile in the **Vehicles** module. This lets different vehicles have different limits without changing the report.
* **From road rules**: Use the map-based speed limit of the road the vehicle is driving on. A fallback value can be entered for road segments where no official limit is known.
Penalty points are configured per minute, in tiers under **Penalty amount for speed limit overrun**. You decide how many points per minute apply depending on how much the driver exceeds the limit. Slight overspeed can be left at zero penalty so it doesn't pollute the report.
The penalty rate that gets applied to a whole speeding episode is the one for the highest tier the driver actually reached during it, even if only briefly.
How the math works
Let's say your settings say:
* **Speeding duration**: 1 minute.
* **Penalty amount for speed limit overrun**: 10 points per minute when over the limit by 20 km/h or more.
A vehicle then exceeds the limit by 21 km/h for 1 minute and 37 seconds.
* The first minute is excluded by the **Speeding duration** setting.
* The remaining time is 37 seconds ≈ 0.62 of a minute.
* Penalty = 0.62 × 10 = about 6.2 points for that episode.
### Harsh driving
Harsh driving covers aggressive maneuvers picked up by the GPS device's motion sensors:
* Harsh acceleration
* Harsh braking
* Harsh turn
* Braking in turn
* Acceleration in turn
* Quick lane change
Combined maneuvers (like braking in a turn) typically deserve a higher penalty than a simple harsh acceleration on a straight road, but the values are entirely up to you.
{% hint style="info" %}
The detection thresholds for harsh maneuvers (how strong a brake or how sharp a turn has to be) are configured in [Devices and Settings](/docs/user/guide/devices-and-settings.md), not in the Eco Driving report. The report only controls how much each event type is penalized.
Not every device model supports every event type. Some report only a subset, and a few don't report harsh events at all. Vehicles whose GPS devices don't report a given event don't contribute that type of penalty.
{% endhint %}
Keep in mind the following:
* Events while the vehicle is essentially stopped are ignored. If the device reports a harsh event but the vehicle is parked or barely moving, it is dropped. This filters out spurious shocks (like potholes, doors slamming, or loading work) on stationary vehicles.
* Repeated events of the same type within a few minutes are merged into a single row, with their penalties summed. Events of different types stay separate: a harsh braking followed shortly by a harsh acceleration still appears as two rows.
### Excessive idling
Excessive idling is detected when the vehicle is stationary with the engine running for longer than the threshold you set. The penalty is then charged per minute for the time spent idling beyond that threshold.
{% hint style="warning" %}
Idling detection requires the GPS device to report engine state / ignition status (or an equivalent input). If the device doesn't provide this signal, idle periods can't be distinguished from regular stops, and no idling penalties will be calculated for that vehicle.
{% endhint %}
How the math works
Let's say your settings say:
* **Idling threshold**: 5 minutes.
* **Idling penalty**: 5 points per minute.
A vehicle then idles for 8 minutes and 14 seconds.
* The first 5 minutes are excluded by the threshold.
* The remaining time is 3 minutes and 14 seconds, which is about 3.23 minutes.
* Penalty = 3.23 × 5 = about 16.2 points for that idle interval.
## How to generate the Eco Driving report
To create an Eco Driving report, follow these steps:
{% stepper %}
{% step %}
### Go to Eco Driving
Navigate to **Fleet Management → Eco Driving**.
{% endstep %}
{% step %}
### Configure main report settings
Select the reporting period, with optional filters for specific days of the week or times of day, and choose the drivers for which the report is generated.
{% endstep %}
{% step %}
### Configure penalties
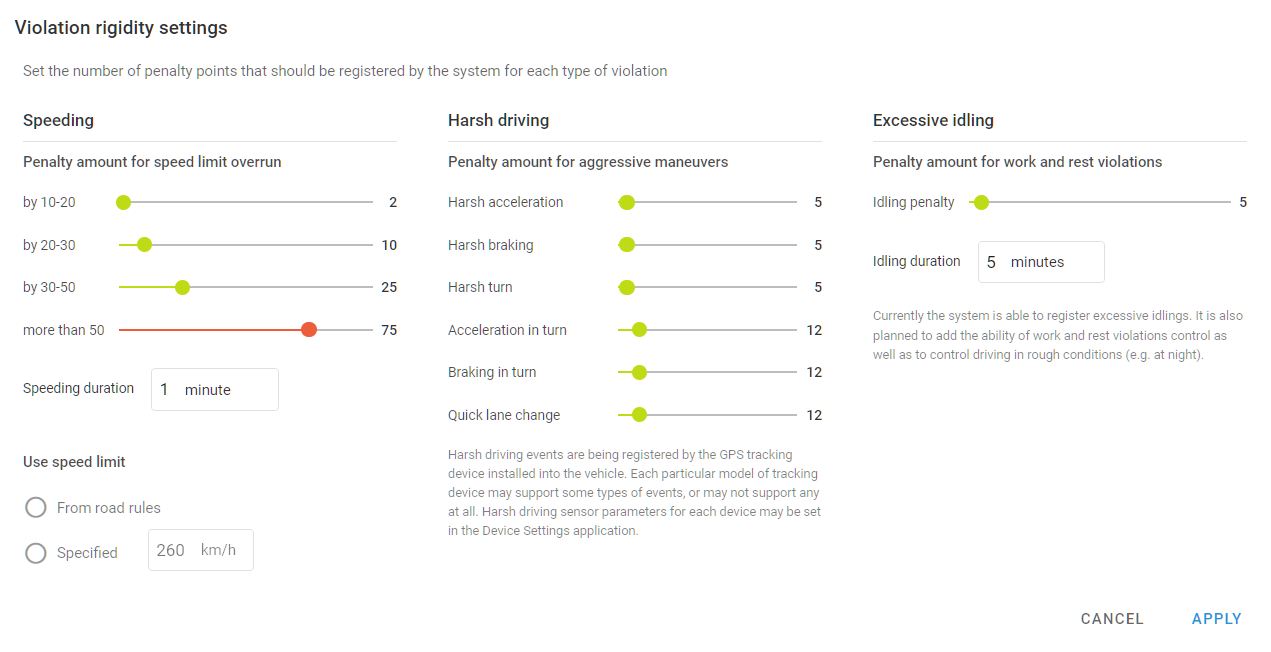
Open **Penalty settings** to customize the report.
Penalty settings
The following settings can be configured:
* **Speeding:** Monitor instances where drivers exceed set speed limits, with penalties adjusted based on the extent and duration of the speeding.
* **Harsh driving:** Track aggressive maneuvers such as harsh braking, acceleration, or sharp turns, with customizable thresholds based on your fleet's devices.
* **Excessive idling:** Identify and penalize drivers for long periods of idling, which can waste fuel and reduce vehicle efficiency.
{% endstep %}
{% step %}
### Create the report
Click **Generate report** and wait for the report to be created to view or download it as a PDF file.
{% endstep %}
{% endstepper %}
## How to read Eco Driving report
### Summary page
The first page of the report aggregates all drivers included in the run. It contains:
* **Total penalty chart**: A stacked bar chart showing how many penalty points each driver or vehicle accumulated, color-coded by violation type:
* **Speeding**
* **Harsh driving**
* **Excessive idling**
* **Rating chart**: A simple bar chart of the 0–100 rating per driver or vehicle, ideal for spotting outliers at a glance.
* **Period summary table**: Rating, mileage, number of penalties, and average penalty per driver or vehicle.
### Driver/vehicle page
Each driver or vehicle receives a separate page with the following:
* A stacked bar chart of penalty points by day, broken down by violation type.
* A summary table with the rating, total penalty, number of penalties, mileage, average penalty, and penalty per 100 km.
* A **Speed violations** table: One row per speeding episode, with start time, address, speed limit, max speed, overspeed amount, duration, and penalty.
* A **Harsh driving** table: One row per harsh event (or grouped events), with start time, address, event type, and penalty.
* An **Excessive idling** table: One row per idle interval, with start time, address, duration, and penalty.
* An **Object** column: A column showing which vehicle the driver was using at the time.
## How to schedule Eco Driving reports
To set up automatic reporting, follow these steps:
{% stepper %}
{% step %}
### Open the schedule tab
Navigate to **Fleet management → Eco Driving → Schedule**.
{% endstep %}
{% step %}
### Pick frequency
Choose how often the report should run (daily, weekly, monthly, or a custom interval) and its delivery time.
{% endstep %}
{% step %}
### Configure other settings
Select drivers or vehicles for which the report is generated and configure **Penalty settings,** including **Speeding, Harsh driving,** and **Excessive idling.**
{% endstep %}
{% step %}
### (Optional) Select recipients
Add the email addresses of everyone who should receive the report.
{% endstep %}
{% step %}
### Save the schedule
The report is generated automatically on the chosen schedule and emailed to the recipients, if any. It is also available for downloading as a PDF file.
{% endstep %}
{% endstepper %}
---
# Agent Instructions
This documentation is published with GitBook. GitBook is the documentation platform designed so that both humans and AI agents can read, navigate, and reason over technical content effectively. Learn more at gitbook.com.
## Querying This Documentation
If you need additional information that is not directly available in this page, you can query the documentation by asking a question.
Perform an HTTP GET request on the following URL with the `ask` and `goal` query parameters:
```
GET https://navixy.com/docs/user/guide/fleet-management/eco-driving.md?ask=&goal=
```
`ask` is the immediate question: it should be specific, self-contained, and written in natural language.
`goal` is what the user is ultimately trying to achieve, the reason they need the answer. Sharing it helps GitBook give you a better, more relevant answer. A goal is most helpful when it describes the outcome the user wants rather than restating the question. For example, with `ask=how do I create an API token`, a goal like `automate deployments from our CI pipeline` lets GitBook tailor the answer to that use case.
The response will contain a direct answer to the question and relevant excerpts and sources from the documentation.
Use this mechanism when the answer is not explicitly present in the current page, you need clarification or additional context, or you want to retrieve related documentation sections.