# Fuel volume report

The **Fuel volume report** provides a detailed view of fuel level changes over a selected period, including both refueling and drain events, daily consumption breakdowns, and an assessment of sensor data quality. All event detection is based on threshold values you configure in the fuel sensor settings, and the report offers several options for controlling how raw sensor data is smoothed and filtered before display.

Choose this report type if your primary concern is detecting fuel theft or unexplained drains alongside refueling events, and you want direct control over how sensor noise is handled. It requires more initial setup (calibration table, drain thresholds, sensor parameters) but gives you full visibility into both directions of fuel movement.

For a simpler, configuration-free alternative that focuses on refueling events and uses automated data processing, see the [Fuel volume 2.0 report](/docs/user/guide/reports/specific-report-details/fuel-volume-2.0-report.md).

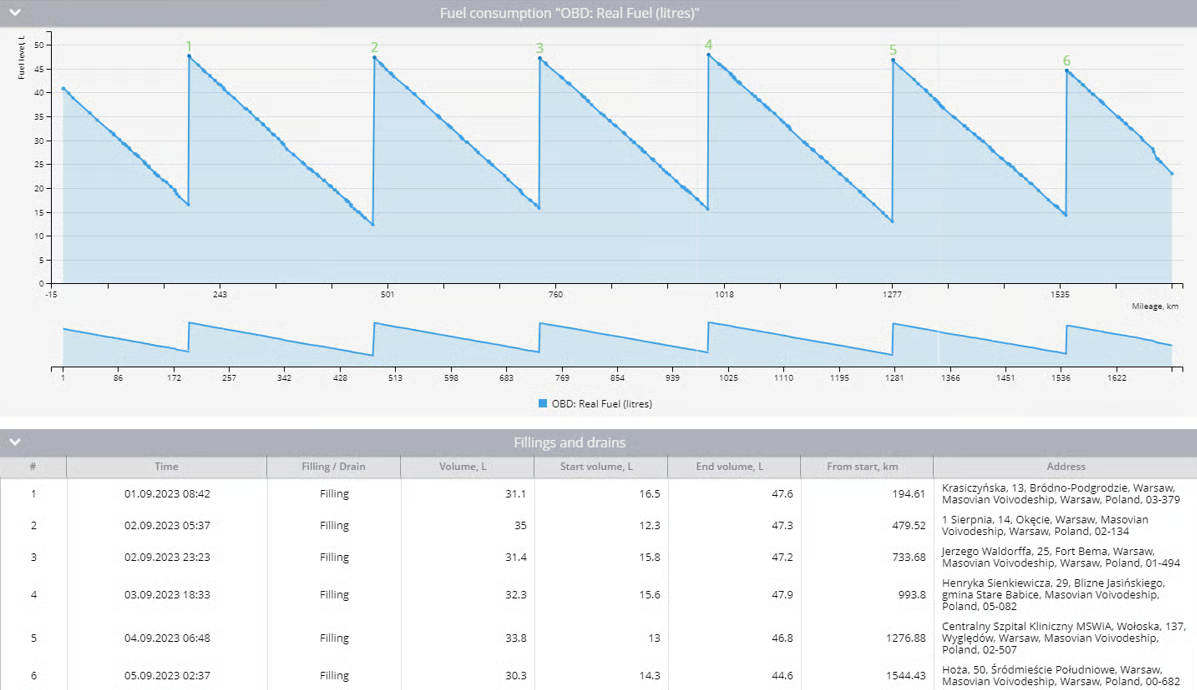
<figure><img src="/files/HQsZhFIfMp9gYBVzkR6z" alt="Fuel volume report"><figcaption><p>Fuel volume report</p></figcaption></figure>

The **Fuel volume report** is composed of the following sections:

1. **Fuel consumption graph**: A chart of fuel level sensor readings plotted over time or mileage, with refueling and drain events marked numerically. Can also show speed if **Show speed** is enabled.
2. **Fillings and drains**: A list of all registered refueling and drain events during the selected period, including volume, timing, and location.
3. **Details by dates table:** A daily breakdown of fuel movement, mileage, and consumption figures.
4. **Statistics data**: Daily and total minimum, maximum, and average fuel levels.
5. **Quality of fuel level sensor readings:** An experimental section that evaluates signal quality of the fuel sensor and provides a numeric score and recommendations.

## Fuel volume report use cases

* **Fuel theft detection**: Drain events can be cross-referenced against vehicle location and speed data. Drains recorded while the vehicle is traveling at speed are almost certainly sensor noise rather than actual theft.
* **Cost accounting**: The report calculates actual fuel consumption per day and per 100 km from sensor readings. For vehicles with a norm consumption rate configured in the vehicle profile, it also shows how actual consumption compares to the manufacturer's norm.
* **Depreciation and logistics calculations**: Daily consumption data per vehicle supports cost-per-trip calculations, fuel allowances for drivers using their own vehicles, or fuel costs per unit of work.
* **Equipment monitoring:** The report works equally well for stationary equipment such as generators, where time-based consumption is more relevant than mileage-based metrics.
* **Sensor performance monitoring**: The quality section provides a quantitative assessment of how noisy the sensor signal is, helping decide whether recalibration or hardware inspection is needed.

## Prerequisites for generating Fuel volume report

For the report to produce accurate data, the following must be configured:

* A fuel level sensor must be connected to the tracker and transmitting data continuously. Gaps in data transmission will appear as shaded areas on the graph.
* The sensor must be configured with units set to liters or gallons. Sensors with units set to **Custom** aren't supported and will produce an error message in place of the report.
* For accurate filling and drain detection, the sensor's calibration table should be filled out according to the manufacturer's recommendations, and the error and drain threshold parameters should be set in the sensor's Advanced settings.
* For multi-tank vehicles, each physical sensor must be calibrated individually and combined into an aggregate sensor with volume units set to liters or gallons.

## Fuel volume report parameters

* **X-axis:** Determines what the horizontal axis of the fuel graph represents. **Mileage** builds the graph against distance traveled and average consumption is shown in l/100 km. Time **builds** the graph against the clock and average consumption is shown in l/h.
* **Detailed info (by dates)**: Adds a daily breakdown table showing initial and final fuel volumes, consumption, and refueling and drain totals for each day of the report period.
* **Display summary:** Toggles the visibility of a summary page showing aggregate data across all selected devices.
* **Display only summary**: Shows only the aggregate summary page without individual device sheets. Requires at least two devices to be selected.
* **Ignition-based consumption**: Uses ignition sensor data instead of movement time to calculate average consumption. Recommended for equipment that frequently idles with the engine running, such as excavators or tractors.
* **Show mileage**: Available only for time-based reports. Adds a mileage overlay on the fuel level graph, which helps correlate fuel changes with driving activity.
* **Show speed**: Adds a speed overlay on the graph. Useful for distinguishing genuine drain events from sensor anomalies: a sharp drop at high speed is likely to be a false alarm.
* **Use smart filter**: Excludes short or invalid trips from the report. A regular trip is excluded if it has fewer than 3 data points, covers less than 100 meters, or stays within a 200-meter diameter. Additionally, individual track points with suspicious mileage patterns (e.g. implausibly high or low speeds) are removed.
* **Smooth data:** Apply smoothing to average sensor readings on the graph, providing a cleaner view of trends.

{% hint style="warning" %}
Smoothing reduces the precision of filling and drain volume calculations.
{% endhint %}

* **Ignore peaks**: Applies a moving median filter that detects and replaces sudden isolated spikes or drops in sensor readings with the local median value. The slider controls how aggressively it filters: move toward **Weak** to remove only the most extreme outliers, toward **Strong** to also eliminate smaller ones.

## How to read Fuel volume report

### Fuel consumption graph

The graph displays fuel level readings from each sensor plotted along the selected axis. Each sensor is shown as a separate graph. If an aggregate (composite) sensor is configured, only the aggregate sensor data is displayed; the individual component sensors are not shown separately.

Refueling and drain events detected during the period are numbered and marked on the graph. The marker appears at the end of the event — when refueling or draining completes — not at its start. Refueling markers are displayed in green; drain markers are displayed in red. The same numbers appear in the **Fillings and drains** table for cross-reference.

Shaded areas on the graph indicate intervals where no data was received from the sensor. This can mean the sensor stopped transmitting, the device was off, or readings were filtered by the sensor's Ignore values setting. A tooltip is shown when hovering over a shaded area.

When hovering over any point on the graph, the exact fuel level, ignition status, and speed at that moment are shown. On mileage-based graphs, the distance traveled from the start of the period is also displayed.

### Fillings and drains table

This table lists all refueling and drain events detected during the report period.

<table><thead><tr><th width="196.22216796875">Column</th><th>Description</th></tr></thead><tbody><tr><td>Number</td><td>Sequential event number, matching the label on the graph.</td></tr><tr><td>Time</td><td>Date and time when the event was recorded.</td></tr><tr><td>Filling / Drain</td><td>Event type.</td></tr><tr><td>Volume</td><td>Fuel volume involved in the event, in liters or gallons.</td></tr><tr><td>Start volume</td><td>Fuel level at the beginning of the event.</td></tr><tr><td>End volume</td><td>Fuel level at the end of the event.</td></tr><tr><td>From start</td><td>Distance traveled from the start of the report period to this event.</td></tr><tr><td>Address</td><td>Location where the event occurred. Clicking the address opens it on the map. If the location falls within a geofence or POI, its name is shown before the address.</td></tr></tbody></table>

A filling is detected when the fuel level increases by more than the absolute error threshold defined in the sensor settings. A drain is detected when the fuel level decreases faster than either the time-based or mileage-based drain threshold specified in the sensor settings — if either threshold is exceeded, the event is recorded.

If the Ignore refills/drains in motion option is configured in the sensor settings, events that begin too far from a parking period (more than X minutes before a stop or after a trip start) are excluded from the table.

### Details by dates

This table only appears when **Detailed info (by dates)** is enabled. It provides a row-by-row daily summary of fuel data for the entire report period, both by GPS and consumption rate and by data from fuel sensors.

<table><thead><tr><th width="262.888916015625">Column</th><th>Description</th></tr></thead><tbody><tr><td>Date</td><td>The calendar day.</td></tr><tr><td>Mileage</td><td>Distance traveled on that day, calculated from GPS data.</td></tr><tr><td>Consumed by norm</td><td>Estimated fuel that would have been used based on the vehicle's norm consumption rate from its vehicle profile. Only shown when a vehicle with a configured norm rate is linked to the tracker.</td></tr><tr><td>Consumption by norm</td><td>The norm consumption rate itself (e.g., l/100 km), taken from the vehicle profile.</td></tr><tr><td>Initial volume</td><td>Fuel level at the start of the day.</td></tr><tr><td>Final volume</td><td>Fuel level at the end of the day.</td></tr><tr><td>Consumption</td><td>Actual fuel consumption for the day: initial volume + total refueled − total drained − final volume.</td></tr><tr><td>Consumption per 100 units (km/miles/etc.)</td><td>Actual consumption divided by daily mileage, multiplied by 100.</td></tr><tr><td>Fillings</td><td>Number of refueling events and their total volume for the day.</td></tr><tr><td>Drains</td><td>Number of drain events and their total volume for the day.</td></tr></tbody></table>

The **In total** row at the bottom uses the initial volume from the first day and the final volume from the last day of the period, combined with the total mileage and all refueling and drain volumes for the full period.

If no sensor data was received for a portion of a day, that gap is marked with a dash. If the fuel level changed during a data gap, those changes cannot be accounted for in the consumption figures.

### Statistical data

This table shows minimum, maximum, and average fuel levels per day and for the full period.

<table><thead><tr><th width="153.5555419921875">Column</th><th>Description</th></tr></thead><tbody><tr><td>Date</td><td>The calendar day.</td></tr><tr><td>Minimum</td><td>Lowest fuel level recorded for that day.</td></tr><tr><td>Maximum</td><td>Highest fuel level recorded for that day.</td></tr><tr><td>Average</td><td>Mean of all sensor readings for that day.</td></tr></tbody></table>

### Quality of fuel level sensor readings

This experimental section evaluates the signal quality of the fuel level sensor by analyzing the noise in the raw readings. It produces a Fuel Sensor Quality Index (FSQI), a numeric score from 1.0 to 10.0.

The score falls into one of three categories:

* **High (8.0–10.0)**: Readings are highly accurate. Reports based on this sensor are the most reliable and provide detailed information on fuel status.
* **Moderate (above 3.0 to 8.0)**: Readings have acceptable accuracy but the signal is somewhat noisy. This may be due to operating conditions or other environmental factors. Reports are reasonably reliable.
* **Low (1.0–3.0):** Readings have low accuracy due to excessive signal noise, which may indicate sensor defects or installation issues. Reports based on these readings carry a significant degree of error.

If the section reports insufficient data for assessment, the most likely causes are: the report period is shorter than the recommended minimum of 14 days of active vehicle operation, the data acquisition interval is too infrequent, or the sensor calibration table quality is poor.

For composite sensors, the quality score reflects the worst-scoring component sensor, since the accuracy of the aggregate reading is limited by its noisiest source.


---

# Agent Instructions: Querying This Documentation

If you need additional information that is not directly available in this page, you can query the documentation dynamically by asking a question.

Perform an HTTP GET request on the current page URL with the `ask` query parameter:

```
GET https://navixy.com/docs/user/guide/reports/specific-report-details/fuel-volume-report.md?ask=<question>
```

The question should be specific, self-contained, and written in natural language.
The response will contain a direct answer to the question and relevant excerpts and sources from the documentation.

Use this mechanism when the answer is not explicitly present in the current page, you need clarification or additional context, or you want to retrieve related documentation sections.
