# Measuring sensors report

The **Measuring sensors report** is designed to provide detailed data from configured measurement sensors or virtual sensors with a source value calculation method over a selected period.

This report allows users to view both graphical and statistical information from their devices' sensors, aiding in effective monitoring and decision-making.

<figure><img src="/files/ocTbNHSlOZftVSDEJ4Am" alt="Measuring sensors report"><figcaption><p>Measuring sensors report</p></figcaption></figure>

## Prerequisites for generating Measuring sensors report

To successfully generate the **Measuring sensors report**, the following conditions must be met:

* **Device compatibility:** Ensure that the device supports the required sensor reading on the platform. You can verify this by checking the list of supported inputs for the specific model.
* **Active data transmission:** The device and its sensors must be configured correctly and actively transmitting data.
* **Virtual sensors:** [Virtual sensors](/docs/user/guide/devices-and-settings/vehicle-sensors/virtual-sensors.md) should have a source value calculation method and provide numeric values to the platform. If a virtual sensor returns invalid (non-numeric) data, the report will display "Unable to calculate sensor report" instead of graphs and tables. Ensure the virtual sensor is correctly configured to provide numeric values.
* **Sensor configuration:** The measurement sensors must be properly configured on the platform.

## Measuring sensors report parameters

The report uses several parameters to tailor the output to your needs:

* **Hide empty tabs:** Omits tabs for devices that have no trips in any configured shift during the selected period.
* **Details time range:** Displays the received readings in increments of 5, 30 minutes, 1, 3, or 6 hours in the data detail table.
* **X-axis on the graph:** Choose whether to display the information by time or mileage.
* **Smooth data:** Apply smoothing to average sensor readings on the graph, providing a cleaner view of trends.

{% hint style="warning" %}
Smoothing may reduce accuracy when analyzing sudden changes such as fuel refills or drains.
{% endhint %}

* **Show address:** Displays the address received by the platform along with the data from the sensor. The address shown corresponds to the first reading in the detail segment.
* **Use smart filter:** Excludes short or invalid trips from the report. A regular trip is excluded if it has fewer than 3 data points, covers less than 100 meters, or stays within a 200-meter diameter. Additionally, individual track points with suspicious mileage patterns (e.g. implausibly high or low speeds) are removed.

For each device, select the sensor for which to generate the report. Only devices with configured [measurement](/docs/user/guide/devices-and-settings/vehicle-sensors/measurement-sensors.md) or [virtual](/docs/user/guide/devices-and-settings/vehicle-sensors/virtual-sensors.md) sensors will be available. If you select a virtual sensor of the wrong type, the report will display the message: "The sensor is not a measuring sensor."

## How to read Measuring sensors report

### Sensor readings graph

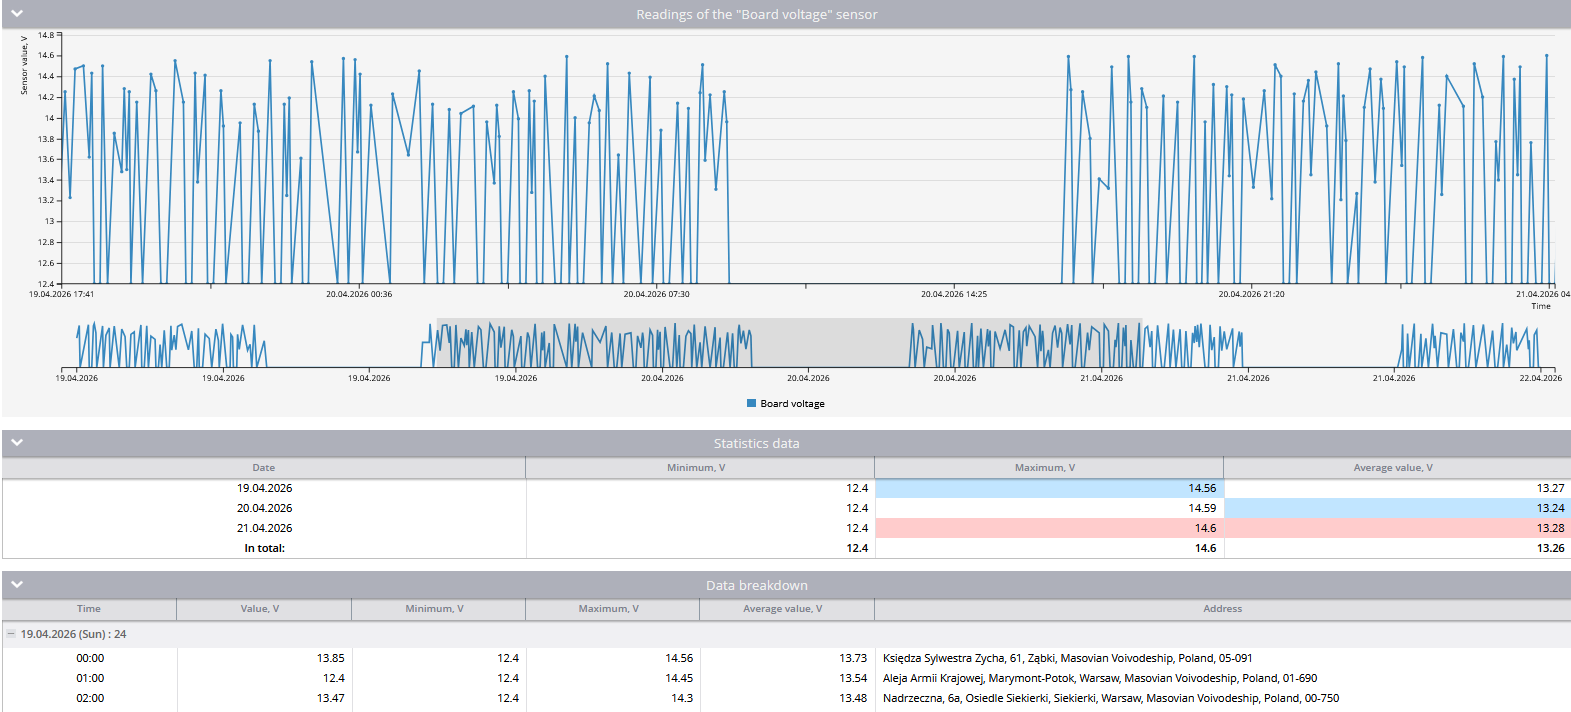
The graph in the report displays measurement or virtual sensor readings in graphical form, helping you visualize data trends over time or distance.

When you hover over a point on the graph, you can view the exact time it was recorded and the sensor value. If the X-axis is set to mileage, you will also see the distance at which the reading was taken.

### Statistics data

A statistical data table that provides daily summaries of the sensor readings. The **Total** row at the bottom of the table summarizes the minimum, maximum, and average values across the entire report period.

<table><thead><tr><th width="195.33331298828125">Column</th><th>Description</th></tr></thead><tbody><tr><td>Date</td><td>The specific date for the recorded data</td></tr><tr><td>Minimum</td><td>The lowest value recorded by the sensor on that date in set units</td></tr><tr><td>Maximum</td><td>The highest value recorded by the sensor on that date in set units</td></tr><tr><td>Average value</td><td>The average of all sensor readings for that date in set units</td></tr></tbody></table>

{% hint style="info" %}
The units of measure will vary depending on the sensor settings.
{% endhint %}

### Data breakdown table

The **data breakdown table** presents sensor readings over specified time intervals, such as every 30 minutes, starting from a set time. It provides a detailed view of sensor data, helping to identify trends or issues during specific periods.

<table><thead><tr><th width="238">Column</th><th>Description</th></tr></thead><tbody><tr><td>Time</td><td>The timestamp for the interval</td></tr><tr><td>Value</td><td>A representative sensor reading for the bucket in set units</td></tr><tr><td>Minimum</td><td>Lowest reading in the interval in set units</td></tr><tr><td>Maximum</td><td>Highest reading in the interval in set units</td></tr><tr><td>Average value</td><td>Average reading in the interval in set units</td></tr><tr><td>Address</td><td>Geocoded location if <strong>Show address</strong> is enabled</td></tr></tbody></table>

{% hint style="info" %}
If the "No data" message appears, it means no readings were received during that time. This could be due to the device not transmitting data, being turned off, or the sensor being disconnected.
{% endhint %}


---

# Agent Instructions: Querying This Documentation

If you need additional information that is not directly available in this page, you can query the documentation dynamically by asking a question.

Perform an HTTP GET request on the current page URL with the `ask` query parameter:

```
GET https://navixy.com/docs/user/guide/reports/specific-report-details/measuring-sensors-report.md?ask=<question>
```

The question should be specific, self-contained, and written in natural language.
The response will contain a direct answer to the question and relevant excerpts and sources from the documentation.

Use this mechanism when the answer is not explicitly present in the current page, you need clarification or additional context, or you want to retrieve related documentation sections.
