How to build a real-time sensor monitoring system for warehouses and beyond

AuthorAndrew M., VP of Data and Solutions
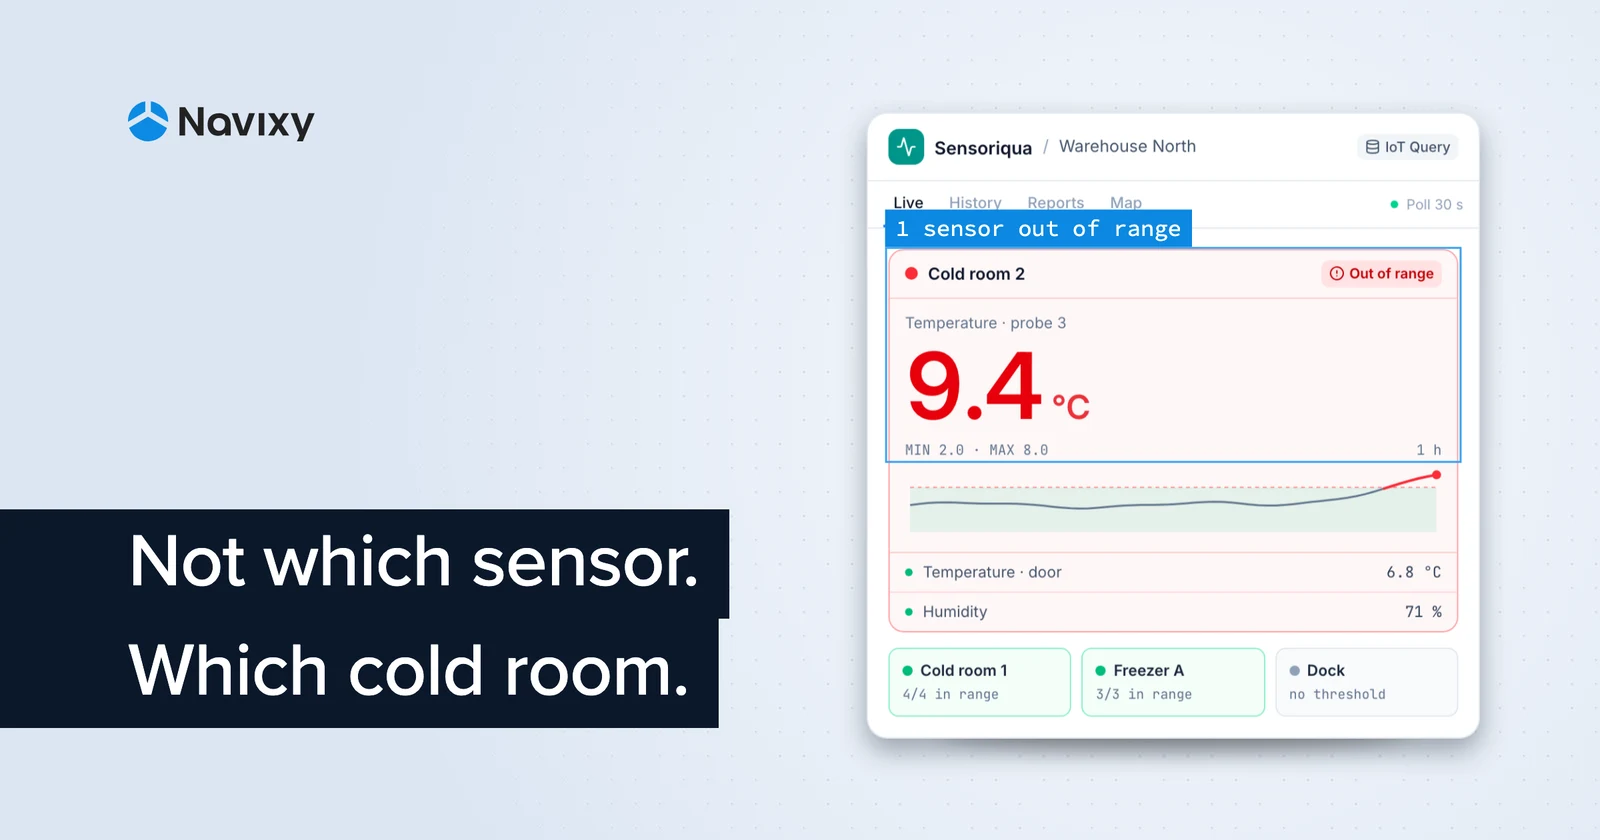
If you build workflows for warehouses, cold-chain sites, or technical facilities, this case study shows how to turn existing telematics data into a purpose-built sensor monitoring system without adding a separate data pipeline. It also breaks down the application architecture, from PostgreSQL access and sensor configuration to live threshold logic, history, reports, and mapping.
Take a warehouse where temperature and humidity readings are already collected through connected devices. The operations team may not need another screen organized by trackers and sensor IDs. They may need a much simpler answer: which cold rooms or storage zones are within their configured range right now?
IoT Query, Navixy's fleet analytics platform, provides structured access to fleet and sensor data through PostgreSQL, while the integrator defines the interface around the client's workflow. Sensoriqua, an application built by a Navixy partner, demonstrates this approach. It groups individual sensor channels by physical zone, applies configured limits, and shows operational status before the underlying raw values.
Clear color coding in the application interface makes the status easier to interpret without checking every reading individually. Green means all configured readings in a zone are within their defined range. Red highlights a zone where at least one sensor is outside its configured threshold. A neutral status means that no threshold has been configured for that sensor.
Where zone-based sensor monitoring applies
The same application pattern can support several monitoring scenarios where users work with physical locations rather than device IDs:
- Pharmaceutical and food warehouse clients may need temperature and humidity records organized by storage zone and documented according to GxP or cold-chain compliance standards. For an audit trail, the relevant question is which zone remained within its specified range, rather than which device ID produced an individual reading.
- Data center and server room clients may need rack-row or room-level status so an operations team can check the condition of a specific area without cross-referencing a spreadsheet.
- Cleanroom and laboratory clients monitor environmental conditions that may vary between individual areas of a controlled space.
- Greenhouse and agricultural clients can monitor microclimates by growing sectors, where conditions may differ across separate sections of the same facility.
- Museum and archive operators can organize temperature and humidity monitoring by room, matching environmental readings to the spaces where collections are stored.
- Industrial clients can group equipment-condition data by production line, workshop, or building wing.
In each case, IoT Query supplies the underlying telematics and sensor data. The integrator determines how the application maps those readings to the locations and operating concepts used by the client.
What makes up a custom sensor monitoring system
Sensoriqua is a reference implementation built by a Navixy partner for a specific type of workflow. The application runs on top of Navixy IoT Query, using direct SQL access to sensor data.
Its architecture combines three core application layers, supported by history, reporting, and map views:
- Data access: a direct PostgreSQL connection to a database within IoT Query.
- Sensor configuration: a persistent mapping between source objects, individual sensor channels, client-defined zones, thresholds, scaling factors, and display labels. Sensor data can be organized independently of the trackers that delivered it.
- Live board: a dashboard that polls recent values at a configurable interval, evaluates thresholds in the browser, and presents aggregate status by zone.
- History and reports: a query view for comparing readings over time, reviewing daily minimum, maximum, and average values, and identifying anomalies or recurring patterns.
- Map: a location view that places monitored objects on a map and lets an operator filter them by threshold condition. This is useful when warehouses or other monitored sites are distributed across multiple locations.
The backend retrieves data and stores application configuration. The frontend calculates the current visual state from the latest response, so zone status does not need to be maintained as a separate server-side record.
Layer 1: Access sensor data directly through IoT Query
During sign-in, the Sensoriqua backend sends the user's credentials to Navixy App Connect. This tool serves as the integration gateway, keeping platform authentication and database access within the Navixy application context while Sensoriqua handles the client-specific workflow.
Sensor readings are available through raw_telematics_data and raw_business_data, with sensor values exposed as columns rather than rows. To populate the list of available sensors for each object, Sensoriqua dynamically queries the column sets in inputs, states, and tracking_data_core.
Explore details about the Raw data layer of IoT Query in Navixy Documentation for analysts.
As a result, an operator configuring the sensor monitoring system sees the device names that are actually present in the client's data rather than choosing from a predefined static list.
Direct SQL access also gives the integrator control over how that data is queried. The application can, for example, calculate 1-minute averages, change sparkline windows, or request a specific historical period without requiring an additional endpoint in a fixed REST contract.
The query and interface can therefore be adapted to the client's monitoring workflow while IoT Query remains the underlying data layer.
Layer 2: Configure sensors independently of trackers
The second layer is a persistent sensor map that defines which sensors belong to each zone and how their readings should be interpreted.
Each configured sensor stores:
- the object and source-table column it reads from
- a human-readable label
- a multiplier, used as a scaling factor before display for unit conversion or calibration scaling
- MIN and MAX thresholds, which define the operating range used for visual status
- a sparkline depth, which defines how many hours of 1-minute averages the sparkline widget displays: 1, 2, 4, or 8 hours
Sensors are organized into named dashboard planes, or panels that correspond to physical zones such as a cold room, server rack row, or greenhouse sector.
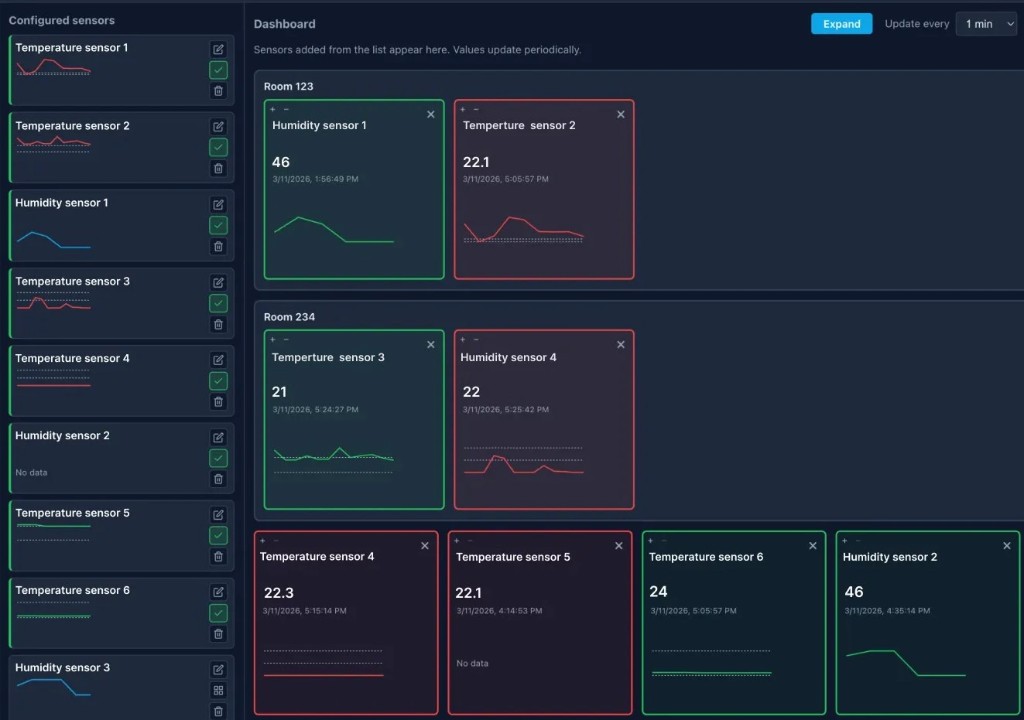
A single dashboard can contain multiple planes, and each plane contains the sensors assigned to that location. This separates the way users work with the monitoring interface from the tracker structure used to transport the original readings.
The sensor map itself is stored in the application's state database.
Layer 3: Calculate live zone status from recent readings
The live board uses polling rather than push updates. It retrieves fresh data at a configurable interval of 30 seconds, 1 minute, or 5 minutes.
The live-data endpoints query IoT Query PostgreSQL directly and return the sensor values. Threshold evaluation then runs in the browser.
After applying the configured multiplier, the frontend compares each reading with its MIN and MAX bounds. A value outside either bound changes that sensor's status to red. If any sensor within a zone is red, the zone panel is also displayed in red. If all configured sensors remain within their thresholds, the panel is green. A neutral sensor has no configured threshold.
This architecture keeps the backend stateless with respect to zone health. It stores configuration and retrieves readings, while the current zone status is recalculated from the latest successful poll.
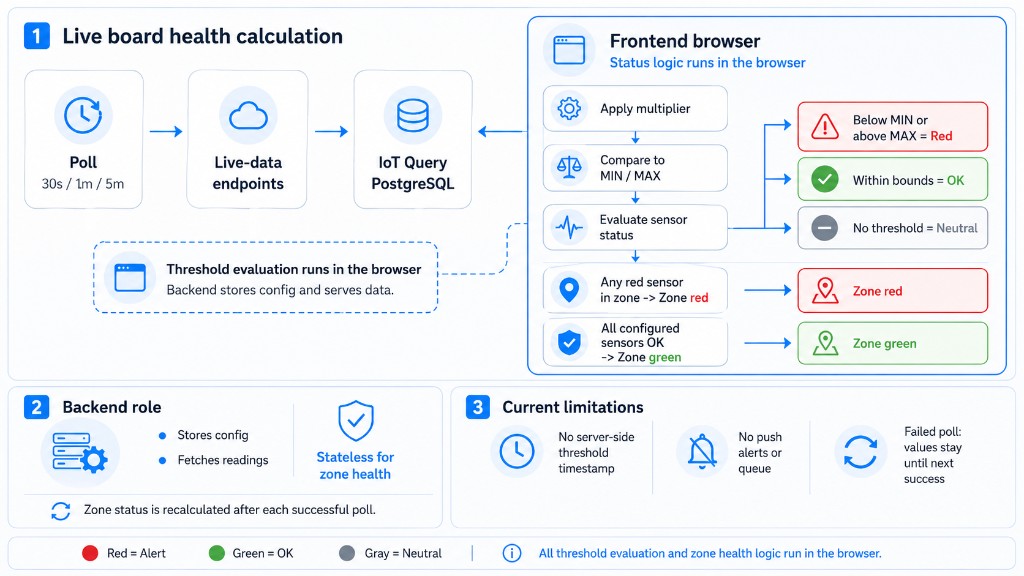
In the current implementation, the application does not maintain a server-side record of the moment a threshold was crossed. It also does not push notifications or queue alerts. If polling fails, the displayed values remain unchanged until the next successful request.
Review historical readings and daily reports
The live board answers the immediate question of whether a monitored zone is currently within range. Sensoriqua's history and reporting views provide the underlying readings for longer-term review.
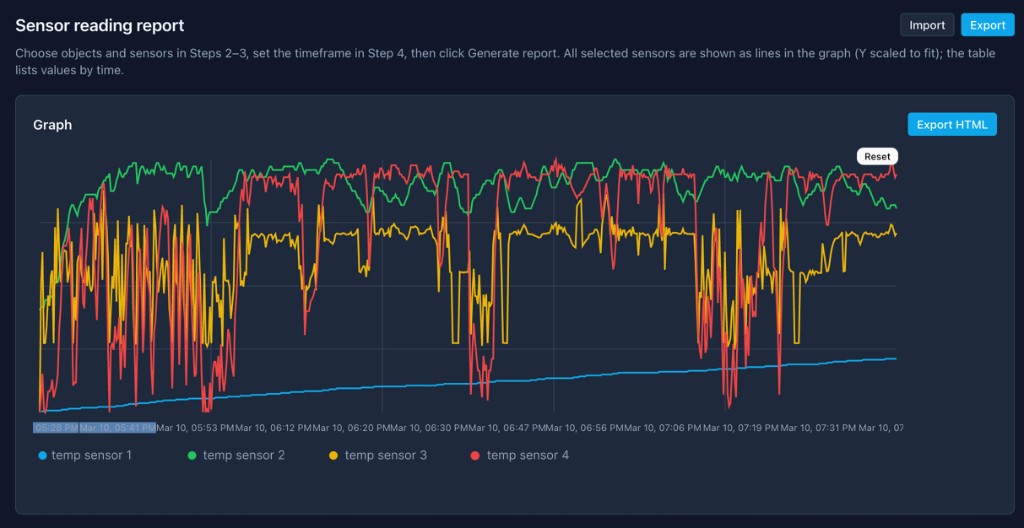
The history endpoint accepts an object ID, sensor name, and time range, then retrieves raw readings from IoT Query for a period of up to 90 days. The application renders them as an interactive chart with threshold bands overlaid.
The report view aggregates the time series into daily statistics for each sensor:
- minimum
- maximum
- average
Reports can be exported in several formats:
- JSON: raw daily aggregates
- HTML and PDF: formatted tables with embedded charts
- XLSX: spreadsheet output
Aggregation and rendering take place in the browser. The backend remains the data-retrieval layer, while the client application generates and downloads the report without an additional server-side rendering step.
Add geographic context to sensor exceptions
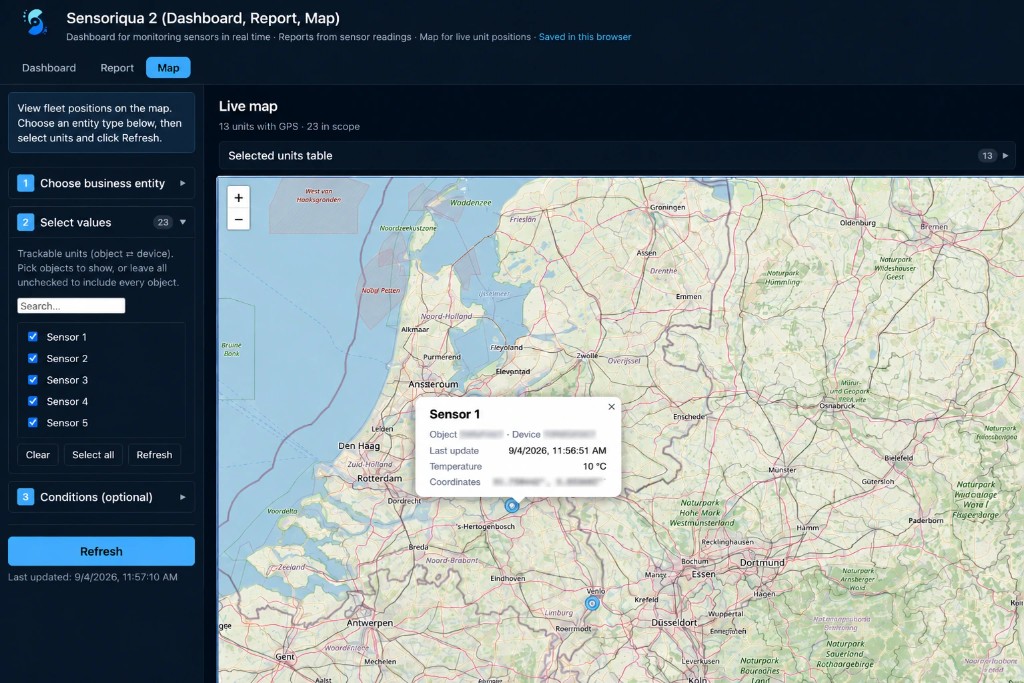
IoT Query also gives Sensoriqua access to the location data associated with monitored objects. Sensoriqua's map view plots the latest GPS position of each object together with its recent sensor readings. Operators can filter the map by business entity and threshold condition.
For a client operating several warehouses or technical sites, the operator can filter for objects with out-of-range readings, locate the relevant site, and open its detailed sensor view.
The object does not need to move for location to be useful. A stationary gateway can identify a fixed warehouse or technical site on the map.
Build the monitoring application on the IoT Query data layer
The IoT Query raw data layer allows Sensoriqua to access the sensor stream through PostgreSQL without introducing a separate middleware API or custom ETL pipeline.
Readings are exposed in a consistent column structure. Sensoriqua developers added zone configuration and threshold evaluation without changing the underlying source data.
From Sensoriqua's perspective, the IoT Query tables remain read-only. The sensor monitoring system acts as an application and visualization layer rather than creating another copy of the telematics data.
Navixy IoT Logic, a data process automation tool, can run rules against the same data stream independently. This keeps data presentation in the custom application separate from workflow automation.
Use Sensoriqua as a reference implementation
For telematics service providers and system integrators, the case study highlights how a custom application can be built using existing Navixy capabilities:
- App Connect authentication
- direct PostgreSQL queries to IoT Query
- a persistent zone and sensor configuration schema
- client-side threshold evaluation
- historical data queries
- daily-summary report exports
- geographic filtering of monitored objects
Sensoriqua uses these building blocks to create a zone-based sensor monitoring system. An integrator can use the same data-access model for other applications, including equipment-health views, customer-specific operational dashboards, custom reports, environmental monitoring screens, or map-based monitoring tools.
If your client has a monitoring workflow that cannot be represented effectively in a standard dashboard, contact Navixy team to discuss options for building a custom IoT Query application.
On this page