Custom analytics in action: live status dashboard for waste management fleet

AuthorKirill E., Navixy Data Analyst
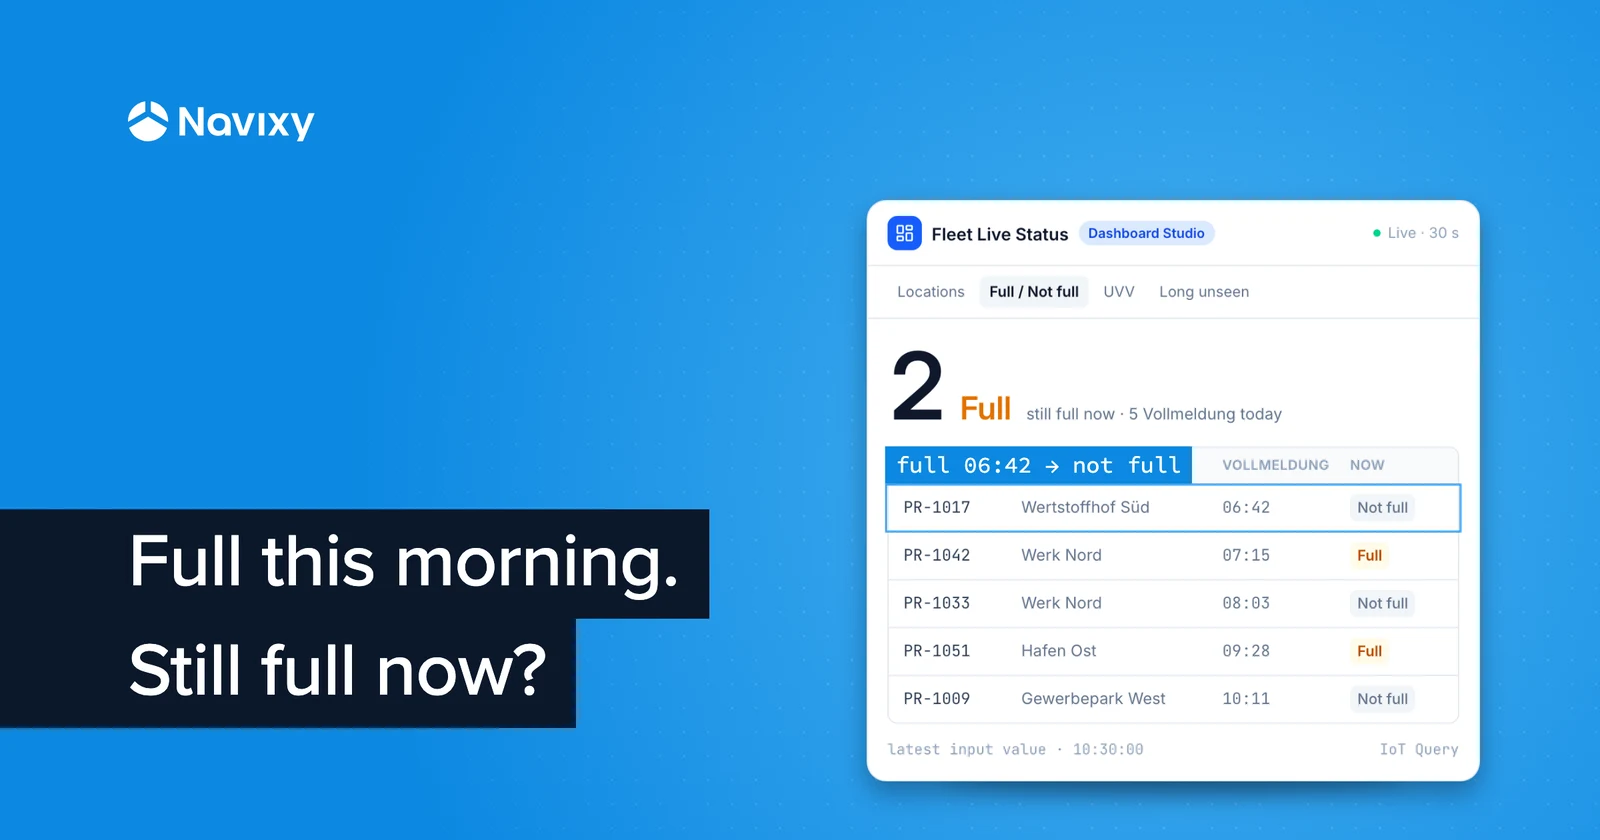
A good fleet dashboard should answer one question within seconds: What needs fleet manager attention right now?
There is no universal answer with a set of metrics for every fleet. Custom analytics starts with the operational questions, business-critical metrics, and daily workflow. Define those requirements first, then build the dashboard or report around them with Navixy’s fleet and transportation analytics platform IoT Query.
For one German waste management operator, getting that answer meant replacing a fragmented daily workflow with a single operational view. Instead of checking several systems to understand what was happening across the fleet, the team needed one place to see the issues that required action.
The result was a custom Waste Management Fleet Status Dashboard built with Navixy using Dashboard Studio, Navixy’s built-in telematics BI tool powered on top of IoT Query.
Challenge: the data existed, but the operational picture did not
The dashboard was created for a waste management company, a customer of Navixy partner from Germany. The business manages mobile industrial waste compactors distributed across multiple locations.
GPS trackers provide location and equipment data, while maintenance tasks, inspection deadlines, and sensor states also need to be monitored as part of daily operations.
The roots of the problem lay in data fragmentation. Equipment status was available in one place, maintenance information in another, sensor alerts somewhere else, while the operational Pressenliste still had to be reconciled with tracking data manually.
For a dispatcher or fleet manager, that data translated into a familiar set of daily questions:
- Where is each compactor now?
- Which compactors are currently full?
- Are any mandatory inspections overdue?
- Has a tracker stopped communicating?
- Is an asset missing from its expected location?
What the team needed was a single operational view showing what required attention right now. That became the basis for building a custom Fleet Live Status Dashboard.
Solution: the custom dashboard built around daily operational questions
The starting point was standard fleet information: location, connectivity, movement, and devices that had not been reported for some time.
Using Dashboard Studio capabilities, the Navixy partner delivered to the client the Waste Management Fleet Status Dashboard that brings location, current equipment state, maintenance tasks, and tracker connectivity together on one screen. It refreshes every 30 seconds, giving dispatchers one place to check the fleet instead of repeatedly moving between systems.
1. See where every compactor is
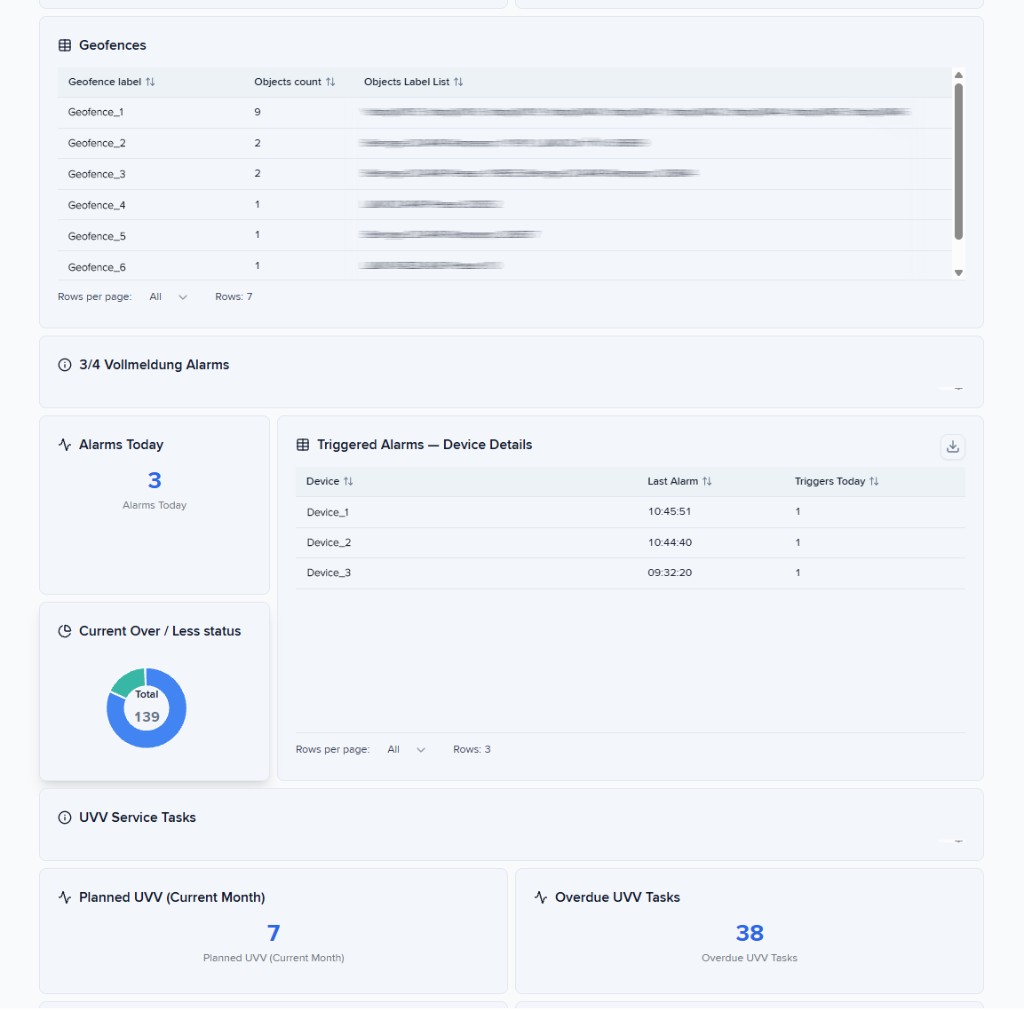
A real-time table shows which assets are currently located at each operating site. The dashboard displays the geofence, the number of compactors inside it, and the individual assets at each location. Assets that exist in the system but are outside all configured geofences are shown separately.
This reduces the need to manually compare the tracker list with the Pressenliste. The dispatcher can see how equipment is distributed across operating locations directly from the dashboard.
The dashboard also keeps the familiar live fleet view of tracker connectivity. Each tracker is classified as online, standby, offline and no signal. Assets also receive a movement status such as moving, stopped, or parked. A separate Long Unseen table highlights trackers that have been silent for the longest time.
This is especially relevant for waste equipment because a compactor may legitimately remain stationary for days or weeks. No new telemetry does not necessarily mean the asset is gone or no longer relevant.
2. Know which compactors are full now
The compactors use sensors that indicate when the configured fill level has been reached. Once the threshold is crossed, the tracker generates full-container notification (Vollmeldung).
An alert tells the dispatcher that something happened. For daily operations, however, the more important question is: Is that compactor still full now?
The dashboard therefore shows both event history and current state:
- Vollmeldung events triggered today;
- trackers that generated them;
- the latest event time;
- compactors currently in “Full“ and “Not full” states.
This distinction between “an event occurred” and “this is the asset’s state right now” is critical for an operational dashboard.
The current Full/Not full status is taken from the latest available state of the configured discrete input. As soon as the tracker sends a new value, the dashboard can reflect the change without waiting for an additional analytics cycle.
The same approach can be used for other discrete equipment states, such as fill-level sensors, lid or hatch opening, limit switches, or other configured inputs.
The technology matters because it enables the operational question to be answered immediately. The fleet manager does not need to reconstruct the current situation from a history of alerts.
3. Keep mandatory inspections in the same working view
The dashboard also includes UVV (Unfallverhütungsvorschriften) inspection tracking and covers mandatory accident-prevention and safety inspections for industrial equipment in Germany.
Previously, inspection deadlines had to be checked in Excel or separately through maintenance tasks. The dashboard now highlights:
- Scheduled this month — inspections due before the end of the month;
- Overdue — inspections already requiring attention;
- Asset, due date, task description, and current status.
Completed tasks are automatically excluded. Instead of opening a full maintenance list, the fleet manager sees only the inspections that still require action.
Result: start with one screen instead of reconstructing the fleet picture
This project was not designed as a formal ROI study, so there are no validated percentages for time savings or operational improvement. The workflow change is much simpler to see.
Previously, understanding fleet status meant checking tracking screens, operational lists, alerts, and maintenance information separately. Now the dispatcher can start with one dashboard and immediately get the answer to their questions.
More importantly, the Waste Management Fleet Status Dashboard preserves the difference between what happened earlier and what is true now. A Vollmeldung from this morning is useful history. Knowing whether the compactor is still full is useful for the next operational decision.
The same applies to silent equipment: the absence of fresh telemetry should not make an asset disappear from the fleet picture.
That is the broader lesson from this project: Do not build a fleet dashboard around the data you happen to have. Build it around the questions an operations manager asks every day.
With IoT Query, fleet managers can build dashboards around the operational questions they need to answer, the metrics they use to make decisions, and the workflows they follow every day. Fleet data, equipment states, maintenance information, and operational context can be brought together in one working view, helping managers spend less time assembling the fleet picture and more time acting on it.
Contact us to discuss how to build an operational dashboard or report around the way your fleet actually works.