Powerful analytics
Comprehensive reports to achieve
operational excellence and cost-effectiveness
Turn data into revenue
Analyze and benchmark fleet expenses, job performance of mobile employees
and driving behavior with various reports and analytical tools offered by Navixy.
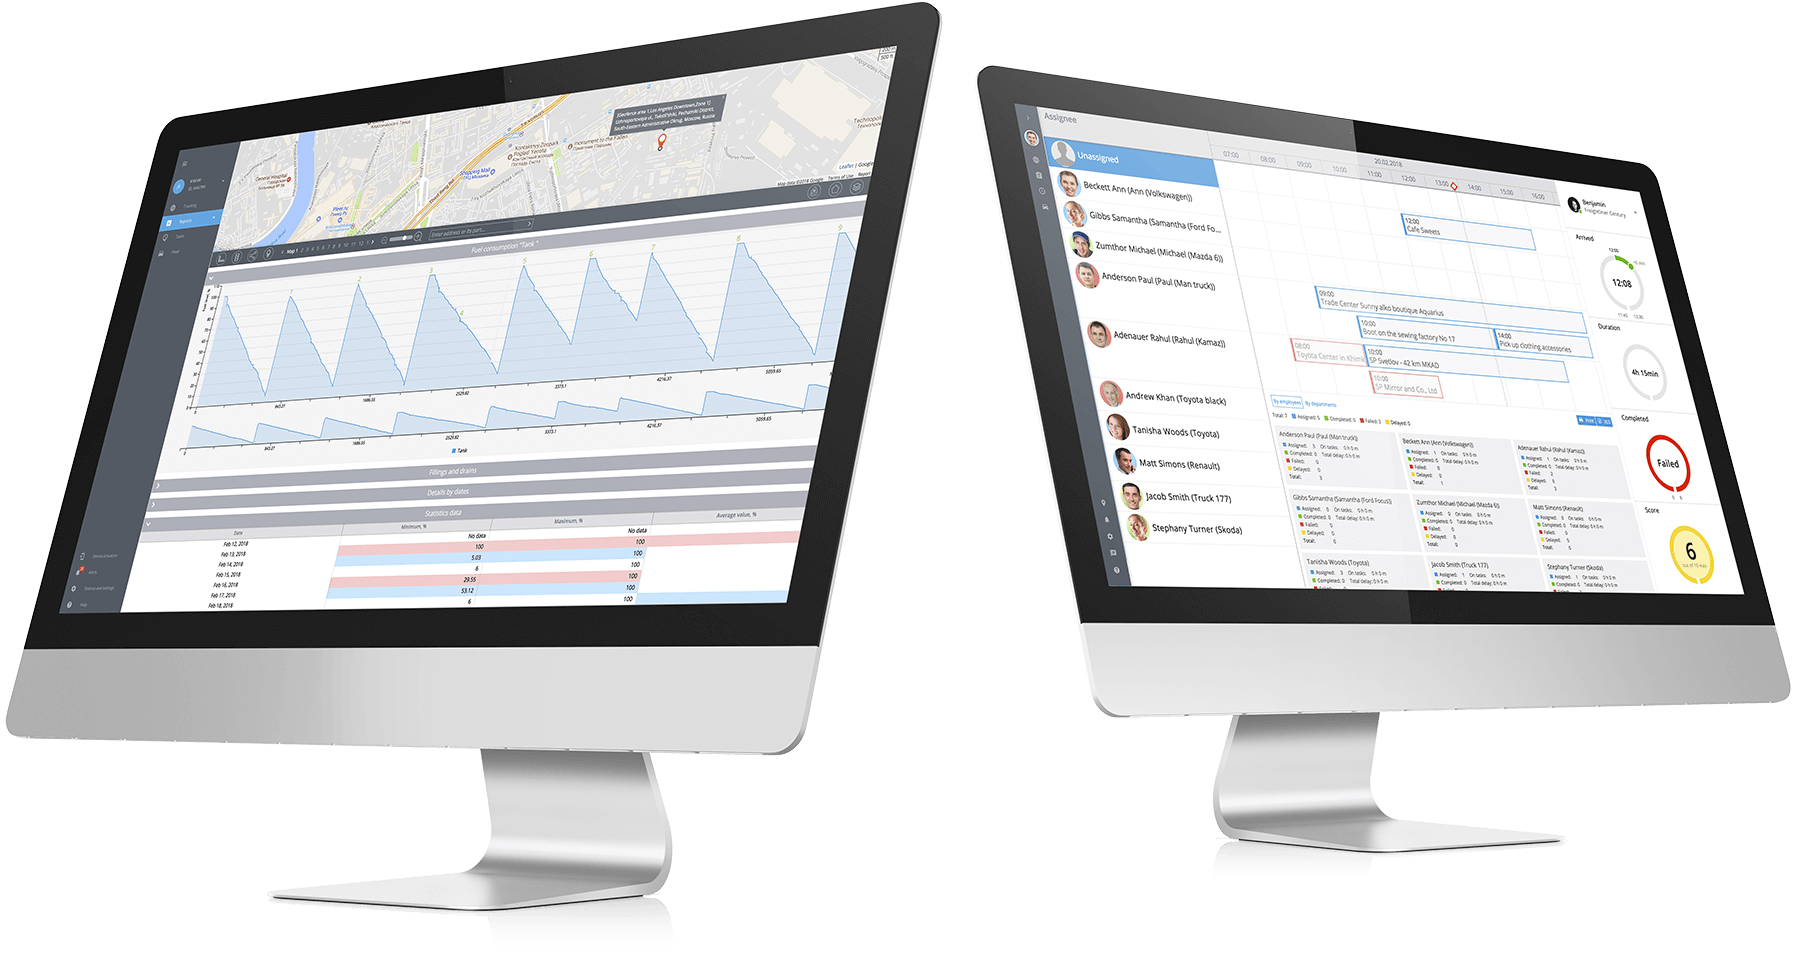
Perform in-depth analysis with visualized data
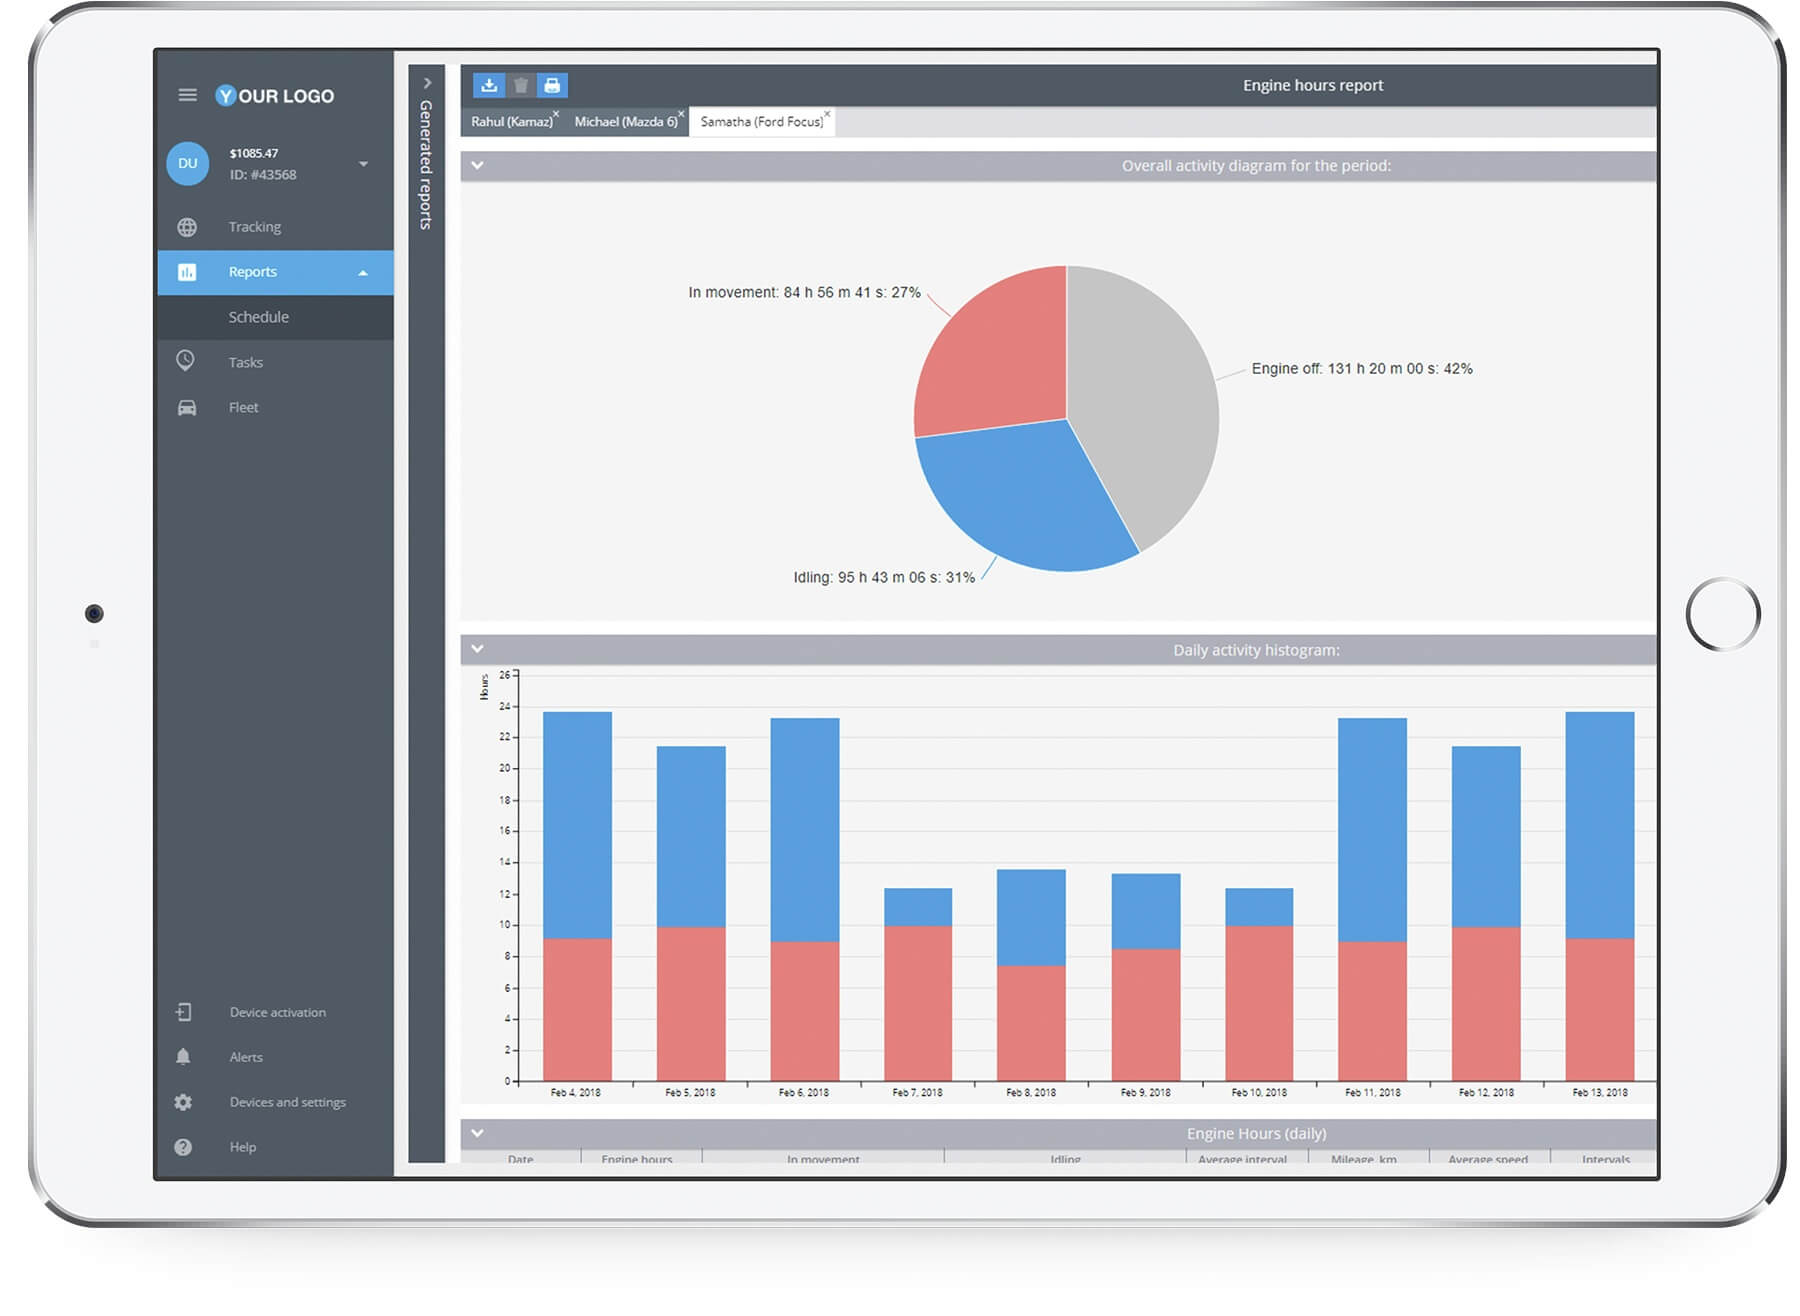
Reports are divided into detailed and summary. Visual tables, color bars and pie charts allow intuitively percieve data.
To perform a comparative analysis, aggregate data by periods and object groups.
Provide each department with relevant analytical reports
Supervisors. accountants and analysts can immediately receive all the necessary data for their work.
Likewise, user access to reports can be limited. It allows to cut off unnecessary functionality and focus on the essential one.
Reports on everything
Get the whole list of reports for in-depth analysis
- Trips
- Stops
- Geofence visits
- Events
- Engine hours
- Fuel volume
- Measuring sensors
- Vehicle sensors
- Speed violation
- Equipment working time
- Tasks report
- Driver shift change
Data driven decisions
Eye-pleasing graphics, charts and vivid tables allow you to comprehensively analyze business processes,
improve the accuracy of forecasting, identify critical points and take steps in the right direction.
Recieve reports on e-mail
Set up a schedule and get reports via email with the necessary regularity. Share information with the colleagues including them in the list of recipients.
Export to Excel and PDF
Save reports in a convenient format for printing, working with data offline or using them with external applications.
API for interprogram communication
Navixy reporting system provides advanced API tools for exchanging and processing information via HTTPS requests from other applications.
