Navixy Platform · IoT Query

    Dashboard Studio

    Build custom dashboards on your telematics datain under 1 minute

    Start with ready-to-use fleet dashboard templates or create custom KPIs, reports, maps, and visualizations using your data, without exporting it to spreadsheets or maintaining a separate BI stack.

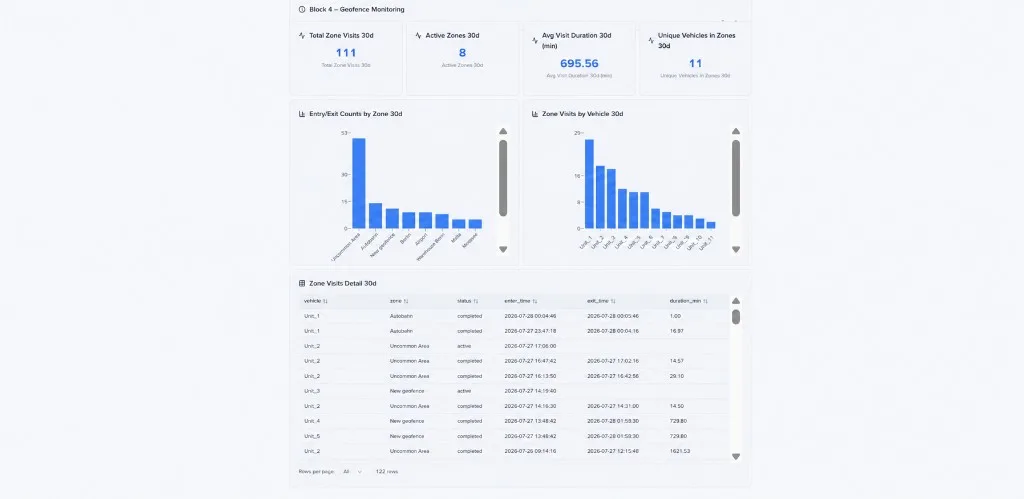
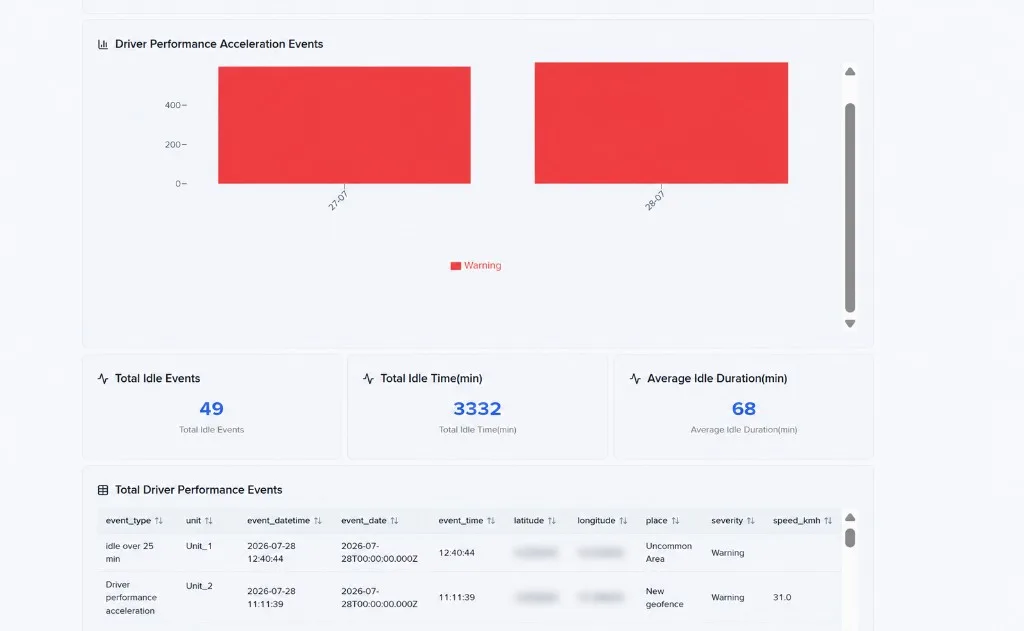
    Fleet Performance dashboard in Dashboard StudioLeasing analytics dashboard in Dashboard StudioHeavy Machinery Trip Operations dashboard in Dashboard Studio

    What is Dashboard Studio?

    Dashboard Studio is Navixy's built-in telematics BI tool — customize a template or build your own dashboard in minutes.

    As an open-source application for Private Telematics Lakehouse, it combines ready-made dashboard templates, a drag-and-drop layout editor, SQL-defined metrics, and interactive visualizations and an AI assistant — giving your team full flexibility to extend, connect, or self-host it.

    Enable Dashboard Studio

    Dashboard Studio template library

    Use ready-to-use fleet management dashboard templates, customize them for your specific KPIs, or create your own custom dashboards based on them.

    Fleet Anomaly Monitor

    Fleet Performance Dashboard

    Fleet Reports Dashboard

    Heavy Machinery Trip Operations

    Heavy Machinery Engine Operation

    Leasing Dashboard

    Object Status Dashboard

    Fleet Anomaly Monitor

    Fleet Performance Dashboard

    Fleet Reports Dashboard

    Heavy Machinery Trip Operations

    Heavy Machinery Engine Operation

    Leasing Dashboard

    Object Status Dashboard

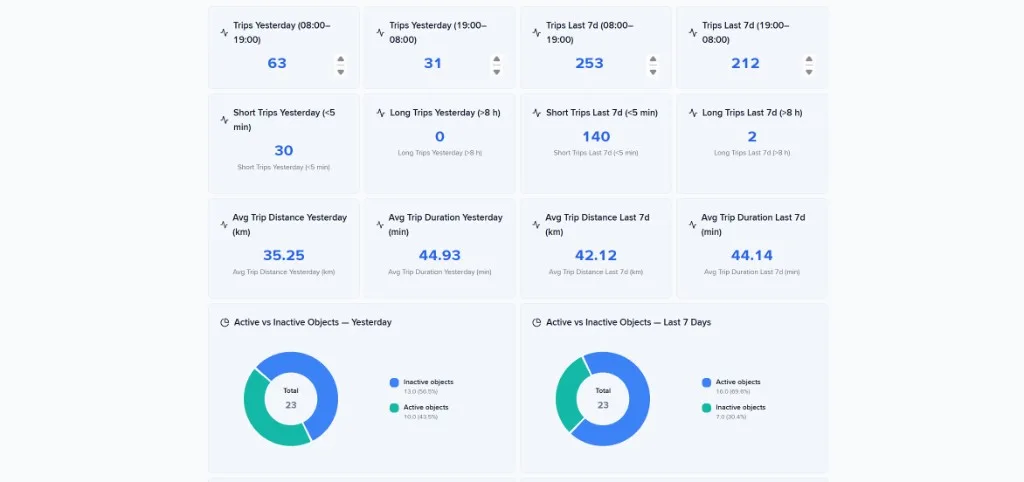
    Trips Dashboard — Yesterday

    Vehicle Mileage Dashboard

    Premium Safety & Security

    Hardware Status Dashboard

    Driver Performance / Driving Score

    Behavior Impact Dashboard

    Hardware Asset Detail Dashboard

    Trips Dashboard — Yesterday

    Vehicle Mileage Dashboard

    Premium Safety & Security

    Hardware Status Dashboard

    Driver Performance / Driving Score

    Behavior Impact Dashboard

    Hardware Asset Detail Dashboard

    How to create a custom fleet management dashboardwith an AI agent

    Tell the AI agent what you want to track — 'show me which drivers exceeded the speed limit last week' or 'fuel spend by vehicle this month'. It writes the SQL, picks the right charts, and hands you a ready-to-review dashboard.

    You review, adjust, and save. That's it.

    1. 1

      Tell AI what you want to see

      Describe your fleet analytics goal in plain language.

    2. 2

      Let AI build it

      Get a ready-to-review dashboard with relevant visualizations and SQL queries.

    3. 3

      Preview before you save

      Check the dashboard against your own data and refine it if needed.

    4. 4

      Make it yours

      Save, edit, and adapt the dashboard to your team's needs.

    5. 5

      Stay in control

      Only authorized users can save and edit AI-generated dashboards.

    Create your own solution based onopen source Dashboard Studio

    Dashboard Studio is a modern open-source analytics workspace built to unlock the full value of Navixy IoT Query through SQL-native dashboards, intuitive visual exploration, and seamless embedding into the existing Navixy interface — giving your team full flexibility to work with telematics and business data.

    View on GitHub

    Build custom fleet management reports that drive decisions

    How to create a custom report in Navixy

    5 reasons to start buildingcustom fleet management dashboards

    • 1Static KPIs that do not reflect your unique service model or compliance rules.
    • 2Fragmented analysis across Excel files, screenshots, and personal dashboards.
    • 3BI fatigue: internal teams hesitate to start another Power BI or Grafana project due to cost, talent needs, or maintenance burden.
    • 4Slow reporting cycles where critical trends are visible only in weekly or monthly summaries.
    • 5No clear ownership: defined roles are missing for designing, updating, or maintaining dashboards.

    Choose the fleet analytics you actually need — nothing more

    From a free built-in dashboard to a fully custom application — start where you are, and grow into the next level whenever you need it.

    Level 1

    Navixy Dashboards

    Free, built-in

    The most important information about your fleet's status, ready out of the box — no setup needed.

    Connect for free
    Dashboard Studio logo
    Level 2

    Dashboard Studio

    Navixy's built-in BI tool — customize a template or build your own dashboard in minutes.

    Activate now
    IoT Query logo
    Level 3

    Custom solutions on IoT Query

    Build the exact analytics your business needs, directly on the IoT Query dataset.

    Explore capabilities

    Learn more about custom fleet management analytics in Dashboard Studio

    Dashboard Studio: get custom fleet analytics in less than a minute
    Read a blog post

    Dashboard Studio: get custom fleet analytics in less than a minute

    Navixy introduces Dashboard Studio, an embedded data visualization tool that lets fleet teams create custom panels for their specific workflows and KPIs without external services or BI projects.

    How to create a custom dashboard in minutes
    Watch a video

    How to create a custom dashboard in minutes

    Watch a step-by-step video guide showing how to build your first custom fleet dashboard using Dashboard Studio's drag-and-drop interface.

    Dashboard Studio Documentation
    Explore Documentation

    Dashboard Studio Documentation

    IoT Query gives you direct access to your data. Dashboard Studio transforms that access into visual answers through custom dashboards without requiring external business intelligence platforms.

    Frequently asked questions about custom fleet management analytics