 IoT Query
Operational intelligence, engineered for answers you can trust.
Unite telematics and business data on a single, governed platform — then build the dashboards, forecasting models, scoring systems, and AI pipelines your business actually needs, without rate limits, nightly exports, or custom ETL work.

What is IoT Query?
Navixy IoT Query is a unified analytics platform that brings telematics, business, and operational data together in a secure, single-tenant environment. Acting as a single source of truth, it manages data ingestion, storage, governance, and infrastructure, so your team can focus on analytics instead of maintaining data pipelines.
Work directly with your complete historical dataset, instead of relying on fragmented, rate-limited APIs or exporting data into separate systems. Transform raw IoT and telematics data into custom metrics, operational KPIs, dashboards, forecasting models, scoring systems, and AI-ready datasets—using Navixy's embedded analytics tools or your preferred BI platform.
IoT Query DocsWho gets value from IoT Query
Same data, different job to do. See how IoT Query helps your role handle daily operations.
Fleet performance you can act on
Three operating signals that help fleet managers react before losses scale
- Spot cost leakage before it impacts monthly targets.
- Prioritize coaching and dispatch actions using measurable risk signals.
- Walk into reviews with one trusted KPI story across all teams.
One governed dashboard, one trusted cost story across every region
Define the KPIs that matter
Set fuel cost per kilometer, idle time per shift, on-time delivery by route, and other operating targets.
Connect your existing BI stack
Power BI or your current tool connects quickly; your team starts seeing live signals within days.
Standardize every region
All teams report from one environment, so operations and finance review the same figures.
Automate refresh, alerts, and reviews
Dashboards stay current, alerts go to the right owner, and performance reviews run on full operational history.
Fleet analytics in action
Practical analytics solutions, built directly on your fleet's telematics data.
Asset utilization
Get more value from your fleet by catching idle vehicles and underused assets early.
Trips efficiency
Keep deliveries on time by spotting late trips and the reasons behind them.
Learn moreDriver safety
Prevent incidents before they happen by ranking driver risk and catching patterns early.
Maintenance
Cut unplanned downtime by catching equipment failures early from real usage data.
Compliance
Stay audit-ready year-round by generating compliance reports straight from your fleet data.
Tailor fleet analytics for your industry
Every industry runs differently. Create a solution that meets your fleet and asset management reality.

Transport & logistics
Optimize fleet performance, reduce fuel costs, and improve delivery operations.

Leasing
Monitor asset usage, automate contract compliance, and improve fleet profitability.

Heavy machinery
Track equipment utilization, optimize maintenance, and reduce unplanned downtime.
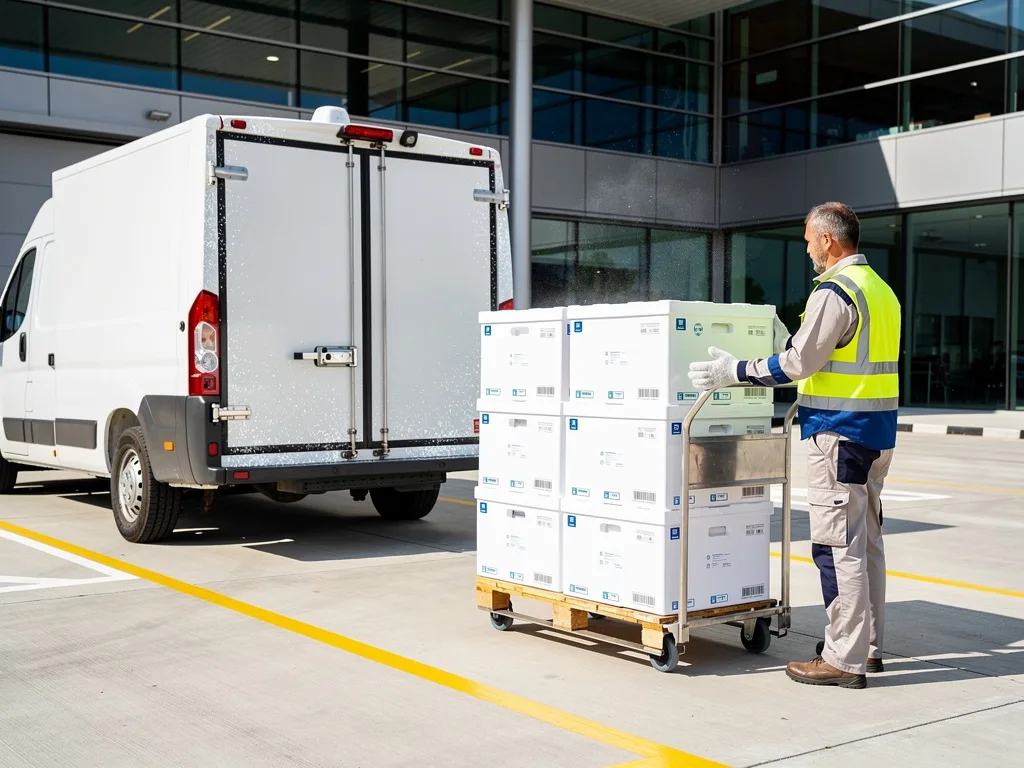
Cold chain
Monitor temperature compliance, protect cargo quality, and reduce operational risk.

Waste management
Verify collections, improve route efficiency, and automate compliance reporting.
More industries
Discover analytics solutions for additional industries and operational use cases in Navixy blog.
Choose the fleet analytics you actually need — nothing more
From a free built-in dashboard to a fully custom application — start where you are, and grow into the next level whenever you need it.
Navixy Dashboards
Free, built-inThe most important information about your fleet's status, ready out of the box — no setup needed.
Connect for free
Dashboard Studio
Navixy's built-in BI tool — customize a template or build your own dashboard in minutes.
Activate nowCustom solutions on IoT Query
Build the exact analytics your business needs, directly on the IoT Query dataset.
Explore capabilitiesFill in the form in a minute to get fully customized analytics
Tell us about your fleet and we'll tailor the analytics setup to your data.
Learn more about Navixy's fleet analytics platform
Dashboard Studio
Build fleet dashboards without a separate BI investment. Stat tiles, bar charts, tables, and PDF reports — all running against your IoT Query data, no extra infrastructure needed.
Analytics & BI
Connect Power BI, Tableau, Grafana, or any PostgreSQL tool to your fleet lakehouse. Explore pre-built SQL recipes or write your own queries for custom fleet analytics.
Architecture & governance
Understand the Private Telematics Lakehouse — data residency, tenant isolation, AES-256 encryption, and the raw/transformation/business-metrics layer model powering your analytics.