Connect operator behavior to asset cost
Track machine hours, fuel burn, idle time, location, and operator behavior — so you can improve utilization, prevent downtime, and run more productive jobsites.
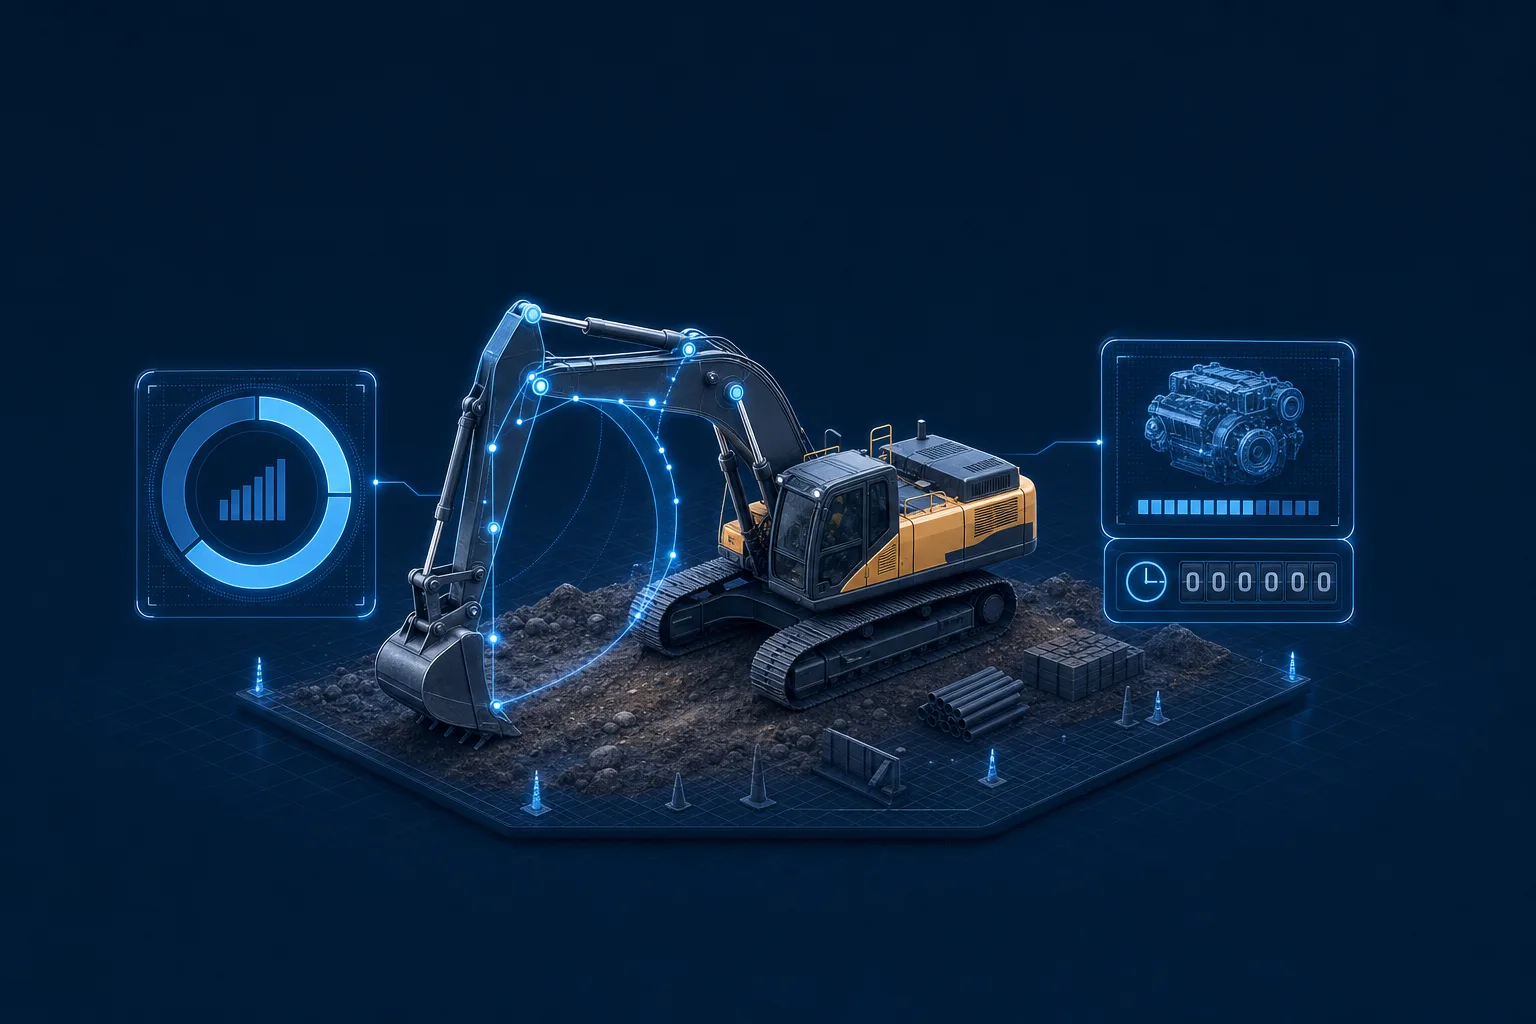
How IoT Query transforms heavy machinery analytics
From raw engine data to asset-cost intelligence — without custom pipelines or middleware.
Engine data tied to operator and site
Join CAN-bus signals with operator IDs and site records in a single SQL query. Maintenance cost per operator becomes a measurable, reportable variable — not an estimate.
Full operating-cycle visibility
Track productive hours, idle time, load cycles, and shift efficiency for every machine — across all sites and equipment classes — with consistent SQL-defined metrics.
Deviation detection before failure
Monitor RPM trends, temperature anomalies, and fuel consumption patterns against baseline. Surface deviations within 24 hours so maintenance teams can act before equipment fails.
How equipment teams get started
Connect machine telemetry
Hook CAN-bus data, GPS positions, and operator IDs from your existing telematics into IoT Query's Raw data layer.
Define utilization KPIs
Set SQL-based utilization thresholds, idle benchmarks, and operator scoring criteria specific to your equipment classes and site conditions.
Build site-level dashboards
Deploy Fleet Performance or Heavy Machinery dashboards to site managers and maintenance teams using Dashboard Studio or your BI tool.
Automate anomaly alerts
Schedule threshold checks on RPM, temperature, and fuel burn — and route alerts to the right maintenance contact before a breakdown occurs.
Ready dashboard templates for heavy machinery
Pre-built SQL templates for operational teams — deploy immediately, customize to your equipment and site structure.
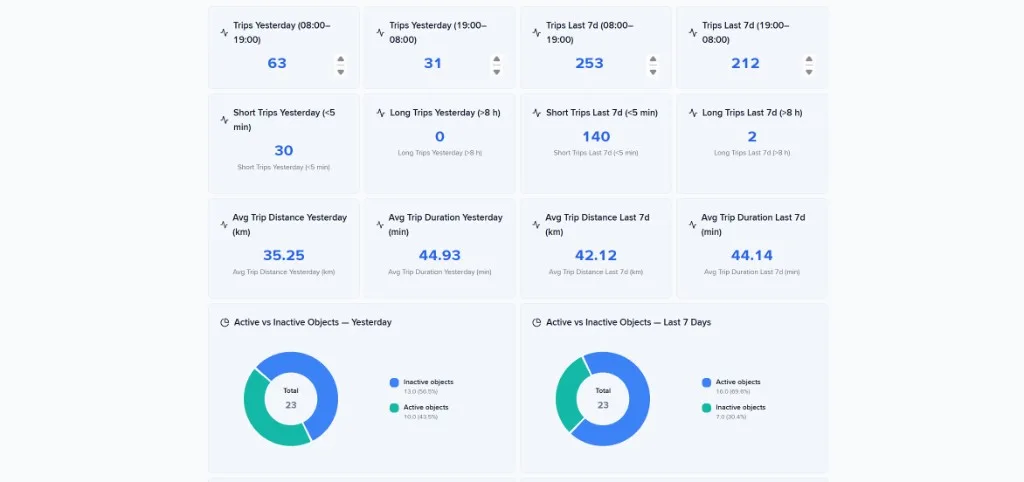
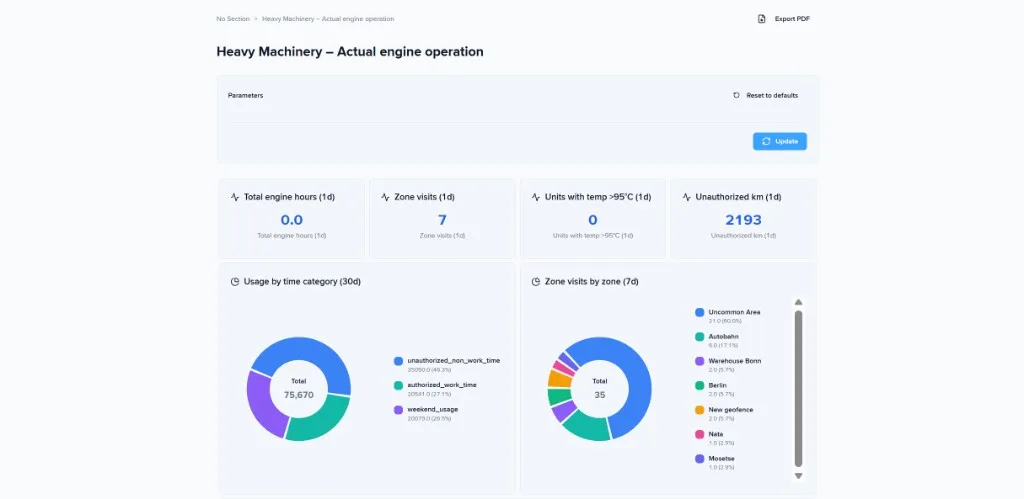
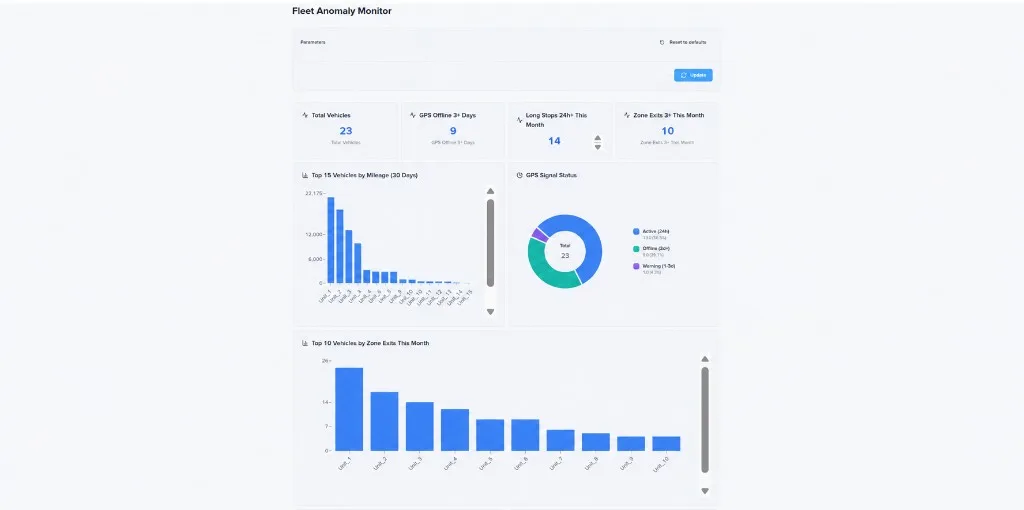
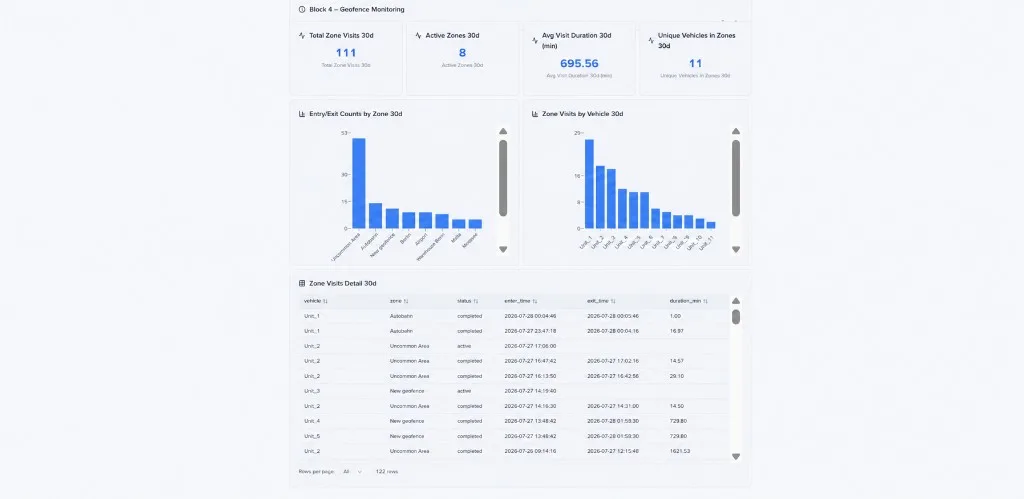
See IoT Query in action for heavy equipment
Real fleets, real workflows — from tracking working hours to building custom construction analytics.
Custom analytics for construction fleets
See how construction fleet operators move beyond spreadsheets and build tailored utilization, cost, and compliance dashboards without custom pipelines.
Heavy equipment operation, monitored end to end
Watch how teams track machine hours, location, and operator behavior in real time.
Track heavy equipment working hours
Learn practical methods for capturing accurate engine hours and utilization data across excavators, loaders, and other heavy equipment.
Ready to see it with your equipment data?
Connect your machine telemetry and build your first heavy machinery analytics dashboard in under 15 minutes.