Meet Navixy Dashboards: essential fleet data at a glance

AuthorAndrew M., VP of Data and Solutions
The Navixy telematics platform launched Dashboards, a free app that brings the most important fleet data into three ready-to-use views.
Fleet teams no longer have to start every check by jumping between the Objects list, map, History, and separate reports. The Dashboards application gives them a faster starting point: what is happening now, or this week, and which vehicles or GPS devices need attention.
For telematics service providers, this creates a practical advantage. You can give customers a clearer first experience in Navixy, reduce routine support friction, and show operational value from the first login. For fleet owners, fleet managers, and maintenance teams, it means fewer blind spots and less time spent searching for basic fleet answers.
Free fleet dashboards are already available in Navixy
Dashboards is currently available in beta, and the app will continue to evolve based on user feedback. Each dashboard uses its own default logic for calculating and aggregating fleet data, so users get a consistent view without additional setup. Because the Dashboards app consolidates data across the entire fleet, these views are available only to main accounts.
Navixy Dashboards currently includes three ready-to-use views for the most common fleet questions.
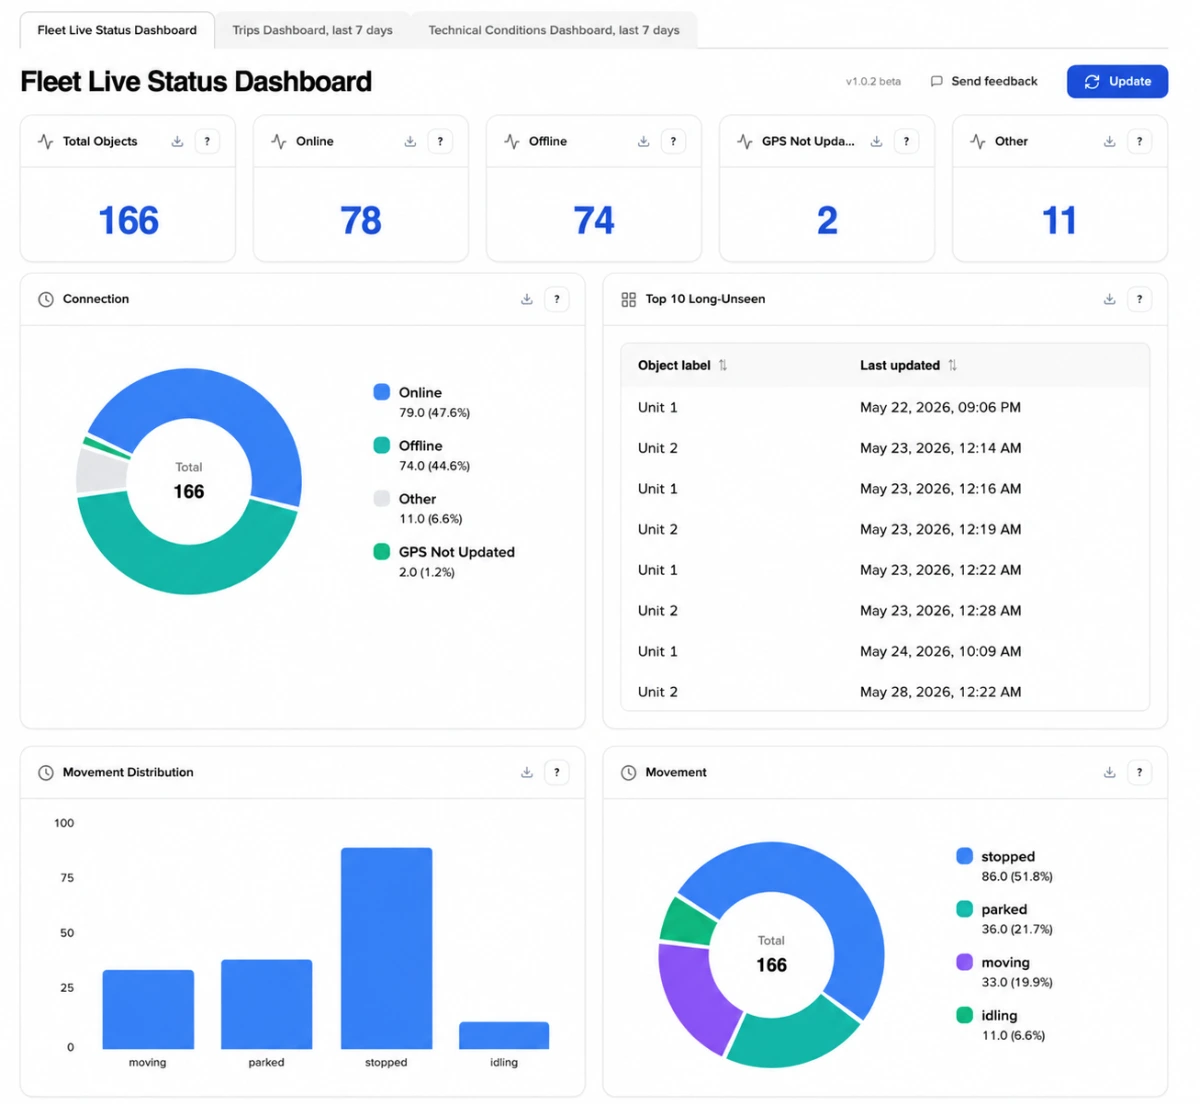
- Fleet Live Status shows what is happening across the fleet right now, including connection status, movement states, speed, geofences, POIs, and objects that have not reported for the longest time.
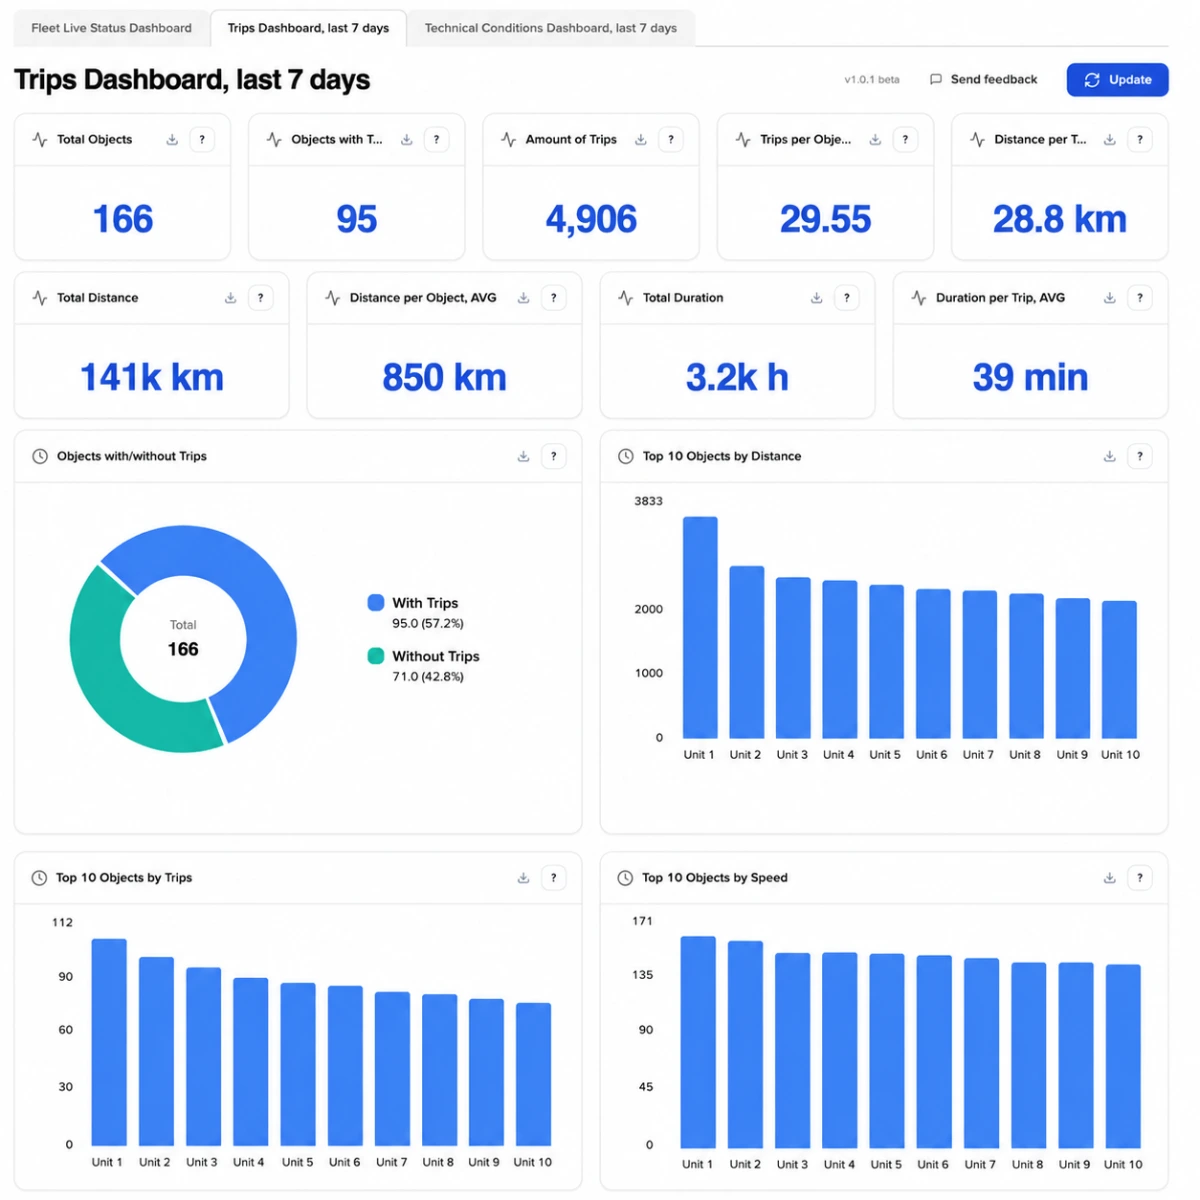
- Trips Dashboard gives a rolling 7-day view of fleet activity, including trip count, distance, speed, idling time, engine hours, and individual trip details. Follow the link to learn more about Trip reports in Navixy.
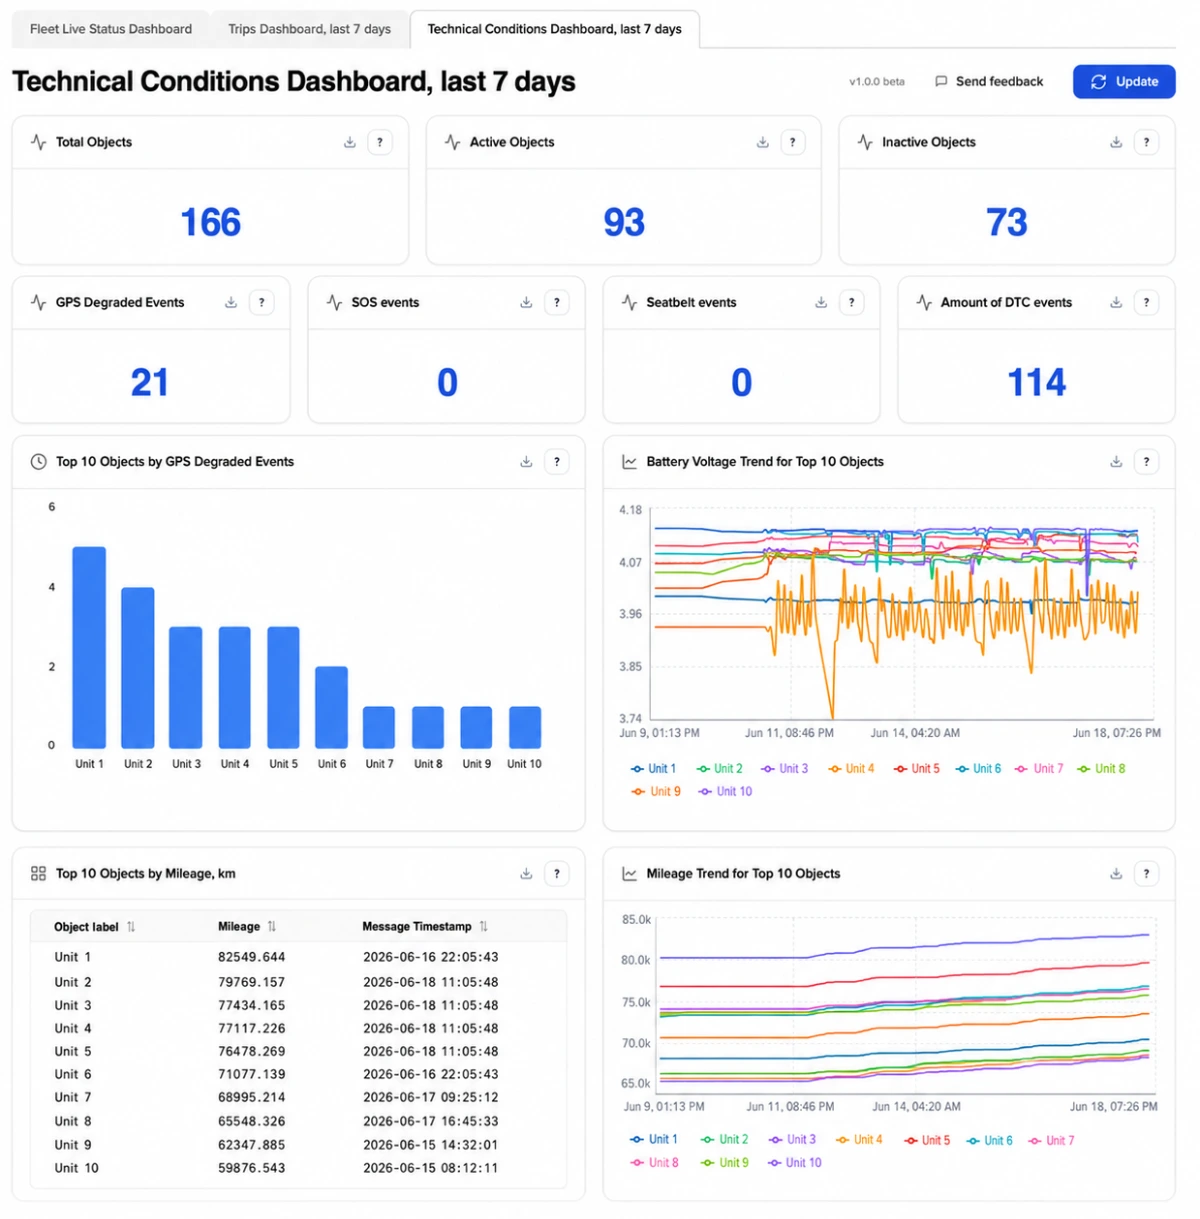
- Technical Conditions helps teams monitor GPS quality, power supply, mileage, and active fault codes before technical issues become downtime or support cases.
Users can clarify what each metric means or send their feedback on each metric by clicking the corresponding button in the upper-right corner of the tile. Your comments help the Navixy team improve Dashboards and deliver more useful solutions for real fleet operations.
Navixy will continue expanding the dashboard collection based on user needs, operational scenarios, and feedback from TSPs and fleet teams. For the exact dashboard logic, metrics, thresholds, and available tables, see the Navixy Dashboards documentation.
How TSPs can use fleet Dashboards as a competitive advantage
For telematics service providers managing connected assets across multiple customers, The new Dashboards app improves both internal service operations and the customer experience.
- Provide first-line support to find silent devices, offline objects, and abnormal movement states before customers report an issue.
- Discuss fleet utilization, inactive assets, and workload distribution openly with customers using recent operational data.
- Detect and resolve GPS degradation, voltage drops, and active fault codes before they become downtime or urgent support cases.
- Share a dashboard snapshot with technicians, account managers, or customers using CSV export.
- Reduce the gap between device activation and visible customer value, making Navixy telematics platform easier to demonstrate, adopt, and expand.
What fleet owners get from the Dashboards app in Navixy
For fleet owners and in-house fleet teams, Dashboards turn telematics data into faster daily decisions across dispatch, operations, and maintenance.
- Dispatchers: Fleet Live Status helps dispatchers start the shift with a clear view of vehicles that are online, moving, parked, idling, offline, or not reporting.
- Fleet managers: Trips Dashboard helps fleet managers review weekly utilization, compare active and inactive vehicles, and spot workload imbalance across vehicles, routes, or teams.
- Maintenance managers: Technical Conditions helps maintenance managers detect GPS quality issues, voltage drops, mileage changes, and active fault codes before they affect service quality or vehicle availability.
- Operations managers: Fleet dashboards help operations managers reduce blind spots across the fleet, shorten routine status checks, and spend less time searching for basic fleet answers in separate Navixy tools.
This is the main value of the app: it does not ask users to change the way they work inside the GPS-tracking and telematics platform. It gives them a faster place to start.
Use built-in dashboards now or custom fleet analytics when needed
The Dashboards app is currently in beta, and the available panels are not editable. They are designed to answer common fleet questions quickly and consistently. Users cannot change their layout, create custom metrics, or build custom views inside the Dashboards app.
If a TSP or enterprise customer needs custom KPIs, custom visualizations, or dashboards tailored to a specific business process, we recommend using Dashboard Studio in IoT Query.
Open Dashboards in Navixy, explore the available beta views, and use Send Feedback to help shape what comes next.
Contact us to see how Navixy fleet analytics can help you detect silent devices, review fleet activity, export dashboard data, and resolve issues before they become support cases.