How to detect fuel drains and refueling fraud with AI

AuthorAndrew M., VP of Data and Solutions
Detecting fuel drains and refueling fraud in telematics data has always been an interesting problem. Modern monitoring systems, Navixy included, handle it well. But AI models are gradually taking the place of classic detection algorithms: they can classify events and find anomalies directly in raw data.
We tested this approach in practice. We built a prototype that passes fragments of telematics data from IoT Query, the Navixy analytics platform, to the Jev model from Typesafe AI and gets back an event classification along with scores that help interpret the result. To be clear: Jev is not positioned as a replacement for existing fuel event detection solutions. It is an additional tool and a new way to build solutions.
The main value of this approach is flexibility and customization. Combining IoT Query and Jev lets developers and system integrators build their own decision-making applications, tailored precisely to the business processes of a specific company. The point is not to replace what already works, but to expand what is possible with AI models.
Where and why AI models like Jev are useful
Jev does not write text and does not generate code. Its main job is to return formalized decisions and probabilities that applications and decision systems can use right away. The model receives two blocks as input:
- The state of the system (parameters, values, JSON context).
- A set of typed questions.
Jev evaluates each question against the state it was given and returns one of the fixed options together with a probability. The user or their agent can then use the results in applications, for example to make decisions.
How to find drains and refuels with Jev
In fleet management, fuel questions are always among the most sensitive. Today, drains happen less often, but receipt fraud has not gone away: the receipt says 50 liters, and 40 actually went into the tank.
Traditionally, moving averages and classic machine learning are used to find such events. Now an AI model can sit at the core of event detection. On raw data, it answers "this is a refuel", "this is a drain", "this is calibration or liquid transfer" or "not sure", and immediately adds the probability and the calculated volume.
For custom analytics in the Navixy ecosystem, IoT Query is a convenient choice. It gives access to the full range of customer data, from telematics to the business data used for integrations and for building your own analytics applications. In our prototype, we use the raw data as the basis for event analysis, and Jev determines which type each event belongs to.
The prototype works in a simple way:
- An algorithm tracks the fuel level and flags candidate events (sharp changes in volume).
- It cuts out a short slice of the time series with telematics parameters.
- It passes the slice to Jev together with typed questions.
- The model returns the event class, the probability and additional estimates.
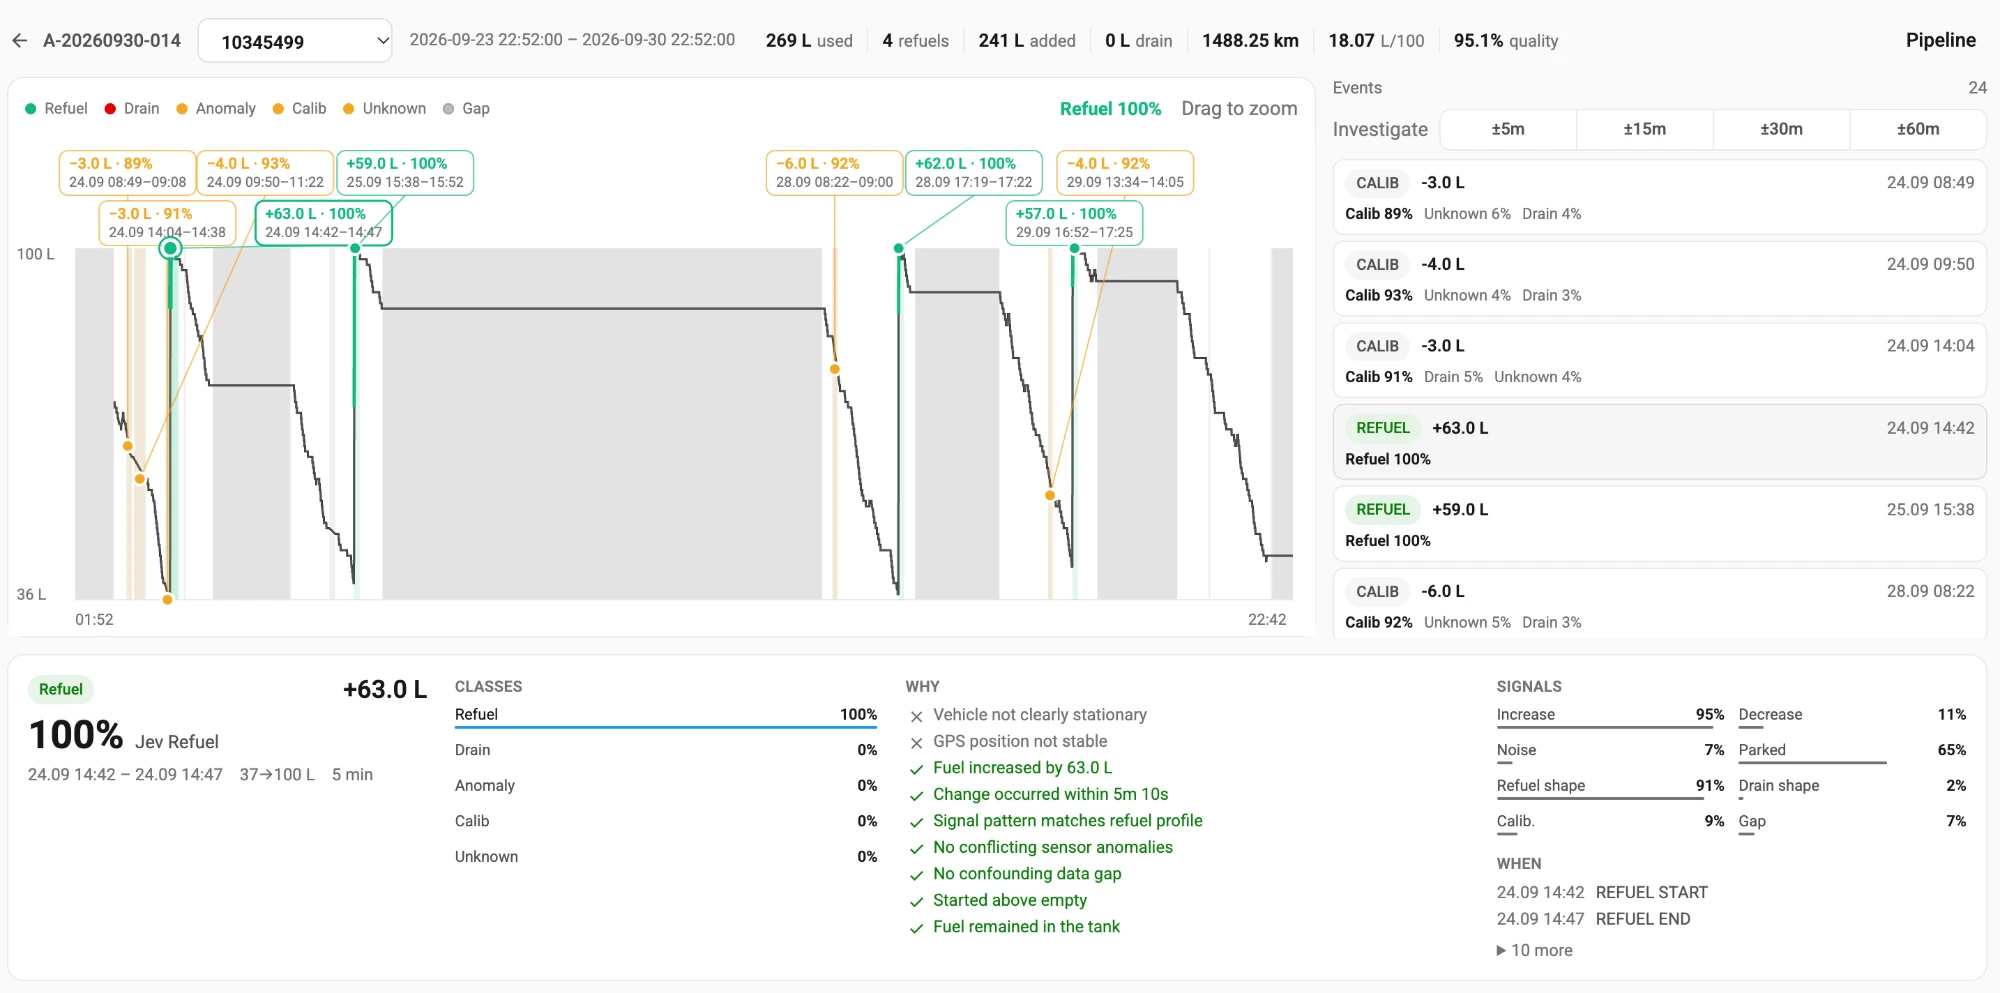
The result is a record like this: 13:32 — refuel, 67 liters, probability 87%
What the request and response look like
Technically, the interaction is simple. We pass the model a state object with the event parameters and a questions object with what exactly needs to be evaluated.
The request to the model:
{
  "model": "typesafe/jev-1.13",
  "state": {
    "vehicle_speed": "...",
    "vehicle_stationary": "...",
    "gps_quality": "...",
    "..."
  },
  "questions": {
    "real_fuel_increase": {
      "type": "noul",
      "instructions": "Is the observed fuel increase a genuine added volume rather than sensor noise, tilt, a spike, or recovery from zero?",
      "criteria": {
        "true": "Sustained, physically plausible increase from a non-empty tank.",
        "false": "Change is within noise, oscillatory, a recovery from zero, or not a real fill."
      }
    },
    "..."
  }
}
The state lists the parameters and values of the window: the tank (before, after, delta, fill rate), movement (speed, whether the vehicle was stationary, GPS), signal quality (noise, gaps, number of points) and profile thresholds (minimum refuel, empty tank, maximum speed at the pump).
The questions are yes/no questions (noul): real increase, real decrease, noise, stationary, looks like a refuel, looks like a drain, calibration. There is also one "choose a class" question (event_type): refuel, drain, anomaly, calibration or not sure.
The response contains scores for the individual signs and the classification result:
{
  "answers": {
    "real_fuel_increase": { "noul": 0.87 },
    "real_fuel_decrease": { "noul": 0.11 },
    "sensor_noise": { "noul": 0.07 },
    "vehicle_stationary": { "noul": 0.77 },
    "matches_refuel_profile": { "noul": 0.94 },
    "matches_drain_profile": { "noul": 0.02 },
    "likely_calibration": { "noul": 0.08 },
    "gap_confounds_event": { "noul": 0.07 },
    "event_type": {
      "choice": "REFUEL",
      "confidence": 1.0,
      "probabilities": {
        "REFUEL": 1,
        "FUEL_DRAIN": 0,
        "FUEL_SENSOR_ANOMALY": 0,
        "CALIBRATION_SHIFT": 0,
        "UNKNOWN_FUEL_EVENT": 0
      }
    }
  }
}
In this example, the model chose the REFUEL class, scored the match to the refuel profile at 0.94 and rated the fuel level increase as real at 0.87.
What results did we get?
We tested the model on weekly data windows, approximating the conditions of a fleet manager's tasks, and compared the results with actual events.
| Metric | Result |
|---|---|
| Data coverage | 93.8% |
| Accuracy | 98.4% |
| Reliability of refuel events and calculated volume | 99% |
The prototype used 25 parameters from the IoT Query raw data layer, including thresholds that can be tuned for a specific fleet and sensors, as well as custom metrics.
This flexibility makes it possible to reflect real workflows: merge consecutive changes into a single refuel event, tell telemetry failures from potential theft, and handle edge cases correctly.
What's next
Refuels and drains are only one scenario. A fleet's daily work has many more tasks like this:
- entering and leaving a geofence: an agreed route change or a violation;
- a long stop: planned unloading or waiting;
- loss of connection: temporary lack of coverage or a device failure.
In all of these cases, the combination of IoT Query (raw data) + Jev (deterministic classification with probabilities) can become the basis for a custom event analytics solution or an autonomous decision-making system. Want to build your own applications on telematics data? Contact us.
To learn more about building agentic systems on telematics data, read our article on conversational analytics.
On this page