Data-Driven Fleet Management: A Complete Guide

AuthorAndrew M., VP of Data and Solutions
Which vehicle should go to the customer with the SLA penalty clause? Which driver needs coaching before, not after, the next preventable incident? Most fleets answer that from a dispatcher's memory — a method that works until the fleet outgrows what one person can hold in their head. Data-driven fleet management is the practice of making those calls from measured signals instead: which vehicle to dispatch, which driver to coach, which asset to retire, decided from facts rather than instinct.
That distinction is worth money. Fleets are buying analytics because intuition scales poorly past a few dozen vehicles — a dispatcher can eyeball ten trucks; nobody eyeballs ten thousand trips a month — and the market reflects it: the global fleet management market is on pace to grow from $32.87 billion in 2025 to $67.03 billion by 2030, a 15.32% CAGR, according to Mordor Intelligence.
But the distinction that matters for a fleet isn't whether it has data. Nearly every fleet with GPS tracking already does. What matters is whether that data changes a decision before the money is spent. A dashboard that reports yesterday's fuel spend is data-collecting. A rule that flags this week's fuel-cost outlier before the invoice arrives is data-driven.
This guide covers what the term means in practice, the KPIs worth measuring, how raw telematics signals become insight, and how to build the stack. See how IoT Query powers fleet data analytics for the mechanism behind the theory below.
What Is Data-Driven Fleet Management?
Data-driven fleet management is decision-making built on measured vehicle, driver, and asset data rather than dispatcher memory or a manager's sense of "how things usually go." The label describes a decision process, not a dashboard. The same fleet can own excellent telematics hardware and still run on intuition if nobody closes the loop from signal to action.
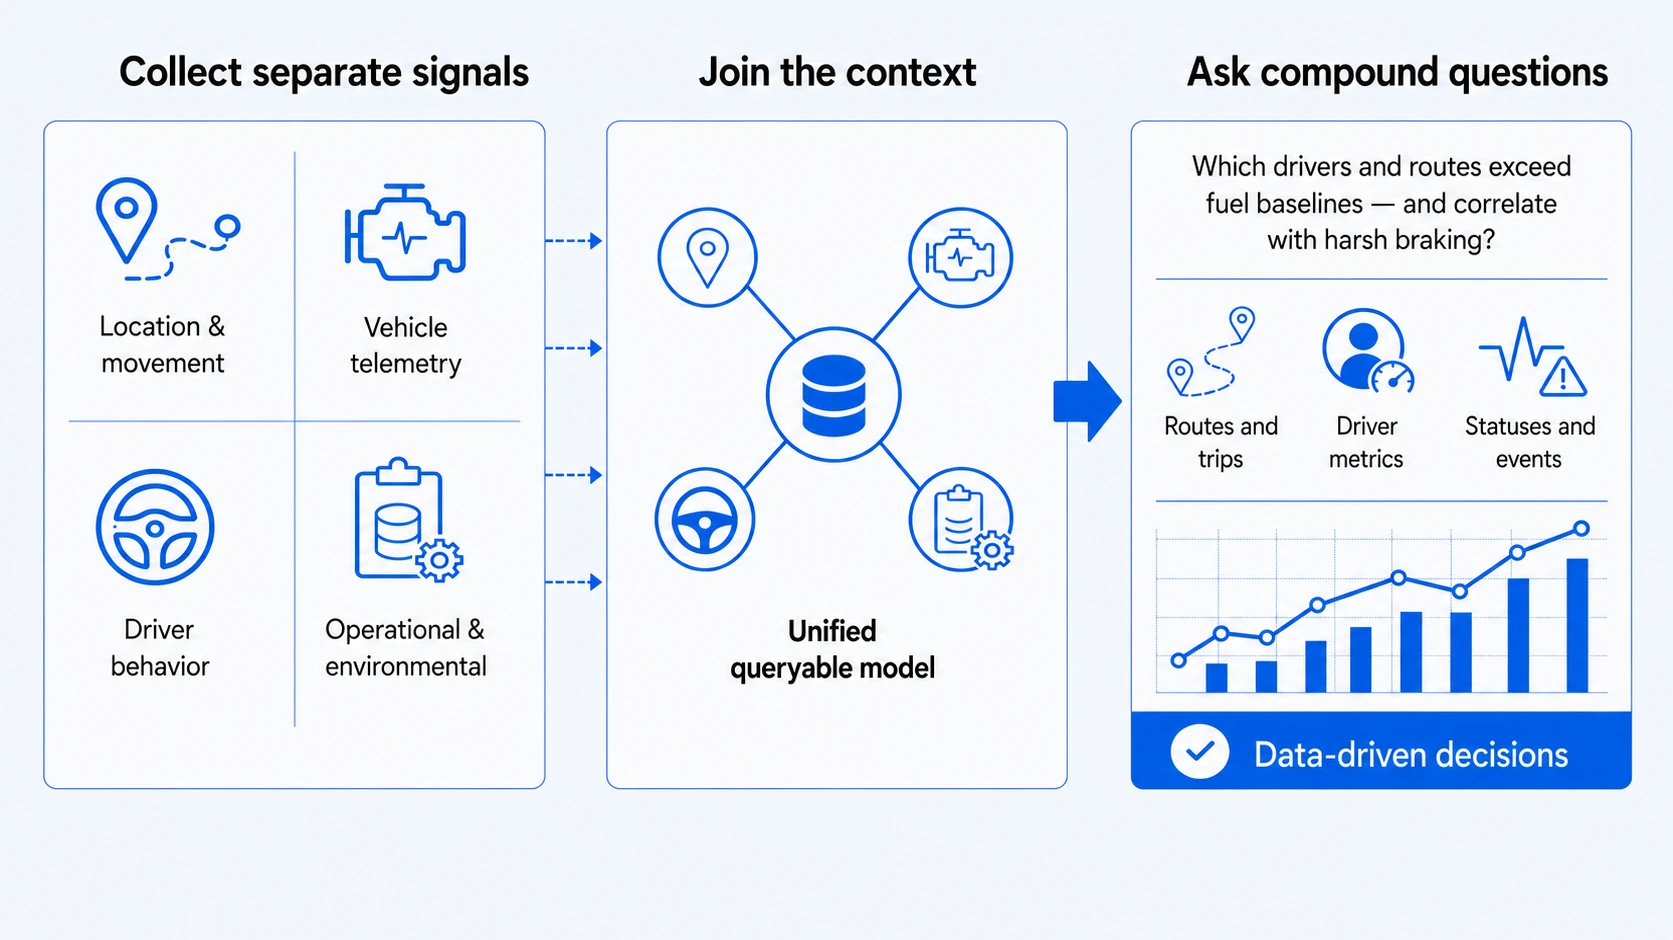
Four signal families make up the raw material:
- Location & movement signals. GPS position, routes, trip history, geofencing events, mileage, and idle time.
- Vehicle telemetry. Speed, fuel consumption, engine RPM, odometer, fault codes, battery status, and other vehicle health indicators.
- Driver behavior signals. Harsh braking, rapid acceleration, cornering, speeding, seatbelt usage, and driving hours.
- Operational & environmental data. Maintenance records, fuel fill-up records, cargo/load statuses, road conditions, and scheduling data.
None of these is new — fleets have collected GPS breadcrumbs for two decades. What has changed is the ability to join them: a fuel anomaly means something different next to a route deviation than it does alone.
That joining step is also the line between "data-collecting" and "data-driven." A data-collecting fleet has live maps, historical trip logs, and maybe a safety scorecard — each useful, each a separate screen. A data-driven fleet asks a compound question across all of them at once: which drivers on which routes burn more fuel than the vehicle's baseline, and does that correlate with the harsh-braking events on the same trips? Answering that requires the sources to sit in one queryable model instead of four exports reconciled by hand.
Read the article to explore the path from telematics visibility to autonomous operational intelligence, or dive deeper into the topic by watching the video on the Navixy YouTube channel.
Most fleets already have gone through the first phase of this shift without noticing: GPS tracking replaced radio check-ins, then electronic logging replaced paper logs, then fuel cards replaced windshield receipts. Each step digitized a record that used to live in someone's head or glovebox. The second phase is a different kind of change, and it's the one "data-driven" actually names: the move from storing those records to querying across them on a schedule that matches the decision, whether that's a daily dispatch call or a quarterly fleet-mix review.
Fleet Performance Analytics: KPIs That Actually Matter
Every fleet dashboard ships with the same starter set — utilization, fuel efficiency, safety score, on-time delivery. They're a reasonable floor for a fleet just starting to instrument itself, and the four categories below are where most fleets get real value once they go past it.
| KPI category | What it actually measures | Common mistake |
|---|---|---|
| Utilization & Productivity | Active hours or miles vs. available hours or miles, by vehicle class | Measuring "moved today" instead of "moved for revenue" |
| Fuel efficiency & Cost optimization | Fuel burned per mile or per job, normalized for load and route | Comparing routes with different terrain or idle time as if they were equal |
| Driver behavior & Risk reduction | Harsh events, speeding, and at-fault-incident rate per 100,000 miles | Scoring every driver against one generic curve regardless of vehicle or route type |
| Compliance / SLA & Service performance | On-time percentage, hours-of-service exposure, contract-specific service windows | Tracking compliance separately from the operational data that explains a miss |
The mistake column matters more than the metric column. A generic safety score built for long-haul trucking will flag a local delivery driver for normal stop-and-go braking. According to the Network of Employers for Traffic Safety, an on-the-job crash cost employers an average of $26,081, while the average employer cost per person injured in such a crash reached $78,418. Numbers large enough that a miscalibrated score carries a real cost well beyond morale.
The fix is a KPI defined for a fleet's own vehicle mix and duty cycle rather than a vendor default. Mexican leasing operators applying that logic to idling and downtime costs have documented the same-day reporting this produces once the KPI is built in SQL instead of borrowed from a template.
The same recalibration applies across the other three rows. A fuel-efficiency baseline should be set per route class rather than per fleet average, because a regional route through hill country will never match a flat highway lane on gallons per mile. An on-time percentage that doesn't separate "late because of traffic" from "late because the load wasn't ready" tells a dispatcher nothing about which lever to pull next.
Telematics Data Analytics: Turning Raw Signals into Insights
A GPS tracker produces a stream of coordinates; a CAN dongle produces sensor values and event flags. Neither is an insight on its own. Telematics data analytics is the layer of work between the raw stream and a business answer, and it usually breaks into three progressive layers: a raw data layer, a data transformation layer, and a business metrics layer.
- The raw data layer holds full-fidelity records: every GPS ping, every sensor reading, exactly as the device sent it. Nothing is discarded or reshaped, which matters when an audit or an incident review needs the original signal instead of a rounded average.
- The data transformation layer cleans and joins that raw data into analysis-ready shapes: trips assembled from pings, idle events separated from stops, zones visits matched to geofences.
- The business metrics layer aggregates the transformation layer into the business-facing numbers a fleet manager actually reads: a utilization rate, a safety score, a per-route fuel-efficiency figure.
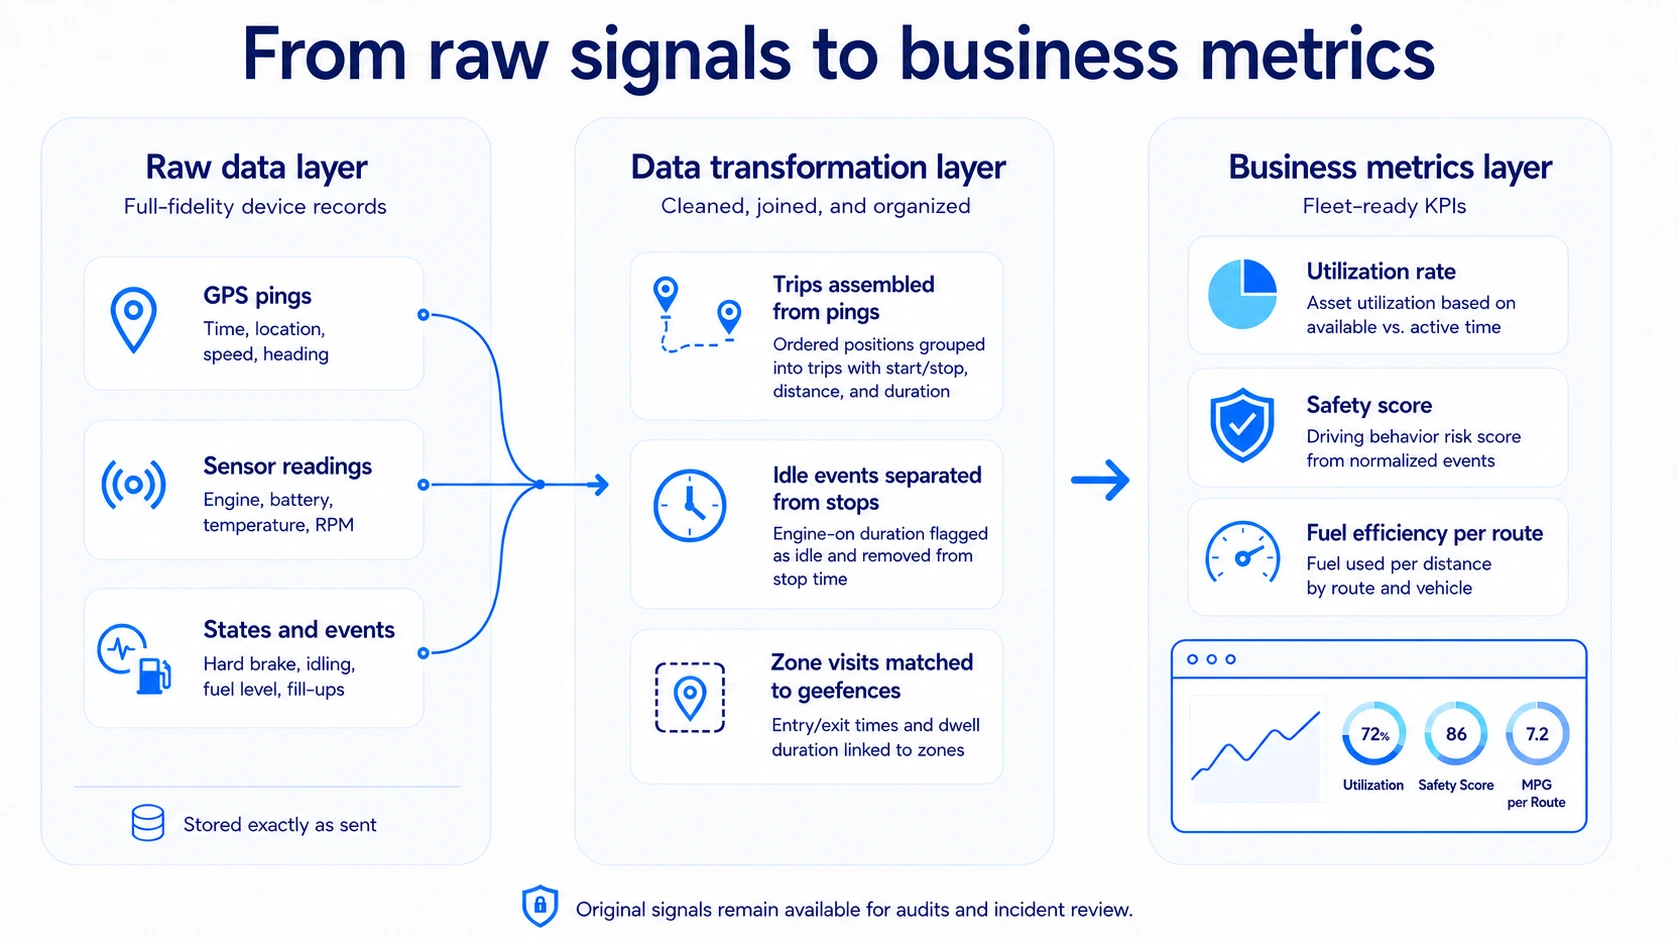
The practical reason this three-layer split beats a single "processed data" table is that different consumers need different layers. A data scientist training a fuel-anomaly model wants the raw layer's full fidelity. A dashboard for regional managers wants the business metrics layer's pre-aggregated numbers refreshed every few minutes rather than raw pings it would have to re-aggregate on every page load. An API-only telematics platform typically hands back business-metrics-level summaries or forces every joined question through a support ticket; a SQL-accessible warehouse lets each team query the layer it actually needs.
That last point is where the API vs SQL distinction earns its place in this discussion rather than being a footnote to it. An API is a fixed menu: it answers the questions the vendor anticipated, in the shape the vendor chose. A query interface answers the question a fleet analyst actually has this week, including the compound, cross-source questions no vendor dashboard shipped with a button for.
That flexibility is also what makes the three-layer split durable. A new question against the transformation or business metrics layer is a new query, not a new integration project.
Fleet Data Management: Breaking the Silo Problem
Telematics lives in one system. Maintenance history lives in another. Billing, customer contracts, and driver HR records live in two or three more. Each system is fine on its own terms. The fragmentation shows up the moment a question crosses the boundary between them, like "Which contracts have mileage exposure this week?" or "Which drivers with poor safety scores are assigned to the highest-value customers?"
Answering a cross-system question by export and spreadsheet is manual integration work performed by hand, every time the question is asked. Someone has to reconcile vehicle IDs, timestamps, and units before the actual analysis can start, and that reconciliation cost repeats on every report cycle.
A unified schema, where vehicles, drivers, trips, contracts, and customers are joinable in one query, moves that reconciliation from a recurring manual task to a one-time modeling decision.
Buying one more dashboard doesn't fix this. A dashboard that visualizes telematics and a separate one that visualizes billing are still two silos with better graphics. The fix is a data model where telematics and business entities are first-class citizens in the same schema, so a single query can return trip data joined to the contract that trip was billed against.
Use case: improving insurance risk-based pricing
A leasing company sizing insurance risk is a concrete version of the same problem. The telematics system knows harsh-braking events and speeding per vehicle; the contracts system knows which customer leases which vehicle and at what liability terms; the claims history sits in a third system entirely. Pricing a renewal accurately means joining all three per vehicle.
Doing that by hand — exporting each system, matching vehicle IDs, reconciling date ranges — takes long enough that most leasing companies price on fleet-wide averages instead, undercharging the risky accounts and overcharging the careful ones. A unified schema turns that quarterly spreadsheet exercise into a query that runs in seconds and can be re-run monthly instead of once a year.
Fleet Utilization: How to Measure and Improve
Utilization is usually reported as a single percentage, and that single number hides the two different questions fleets actually need answered: is the vehicle moving, and is the vehicle earning? A refrigerated truck idling at a loading dock with its reefer unit running is not moving, but it may be doing exactly the job it exists for.
A defensible utilization formula starts from active time (or active miles) divided by available time (or available miles), where "available" excludes scheduled downtime like maintenance windows. It then splits the active bucket into revenue-generating activity and non-revenue activity such as staging, fueling, or waiting.
Benchmarks vary sharply by vertical: a long-haul line-haul truck and a last-mile delivery van have structurally different utilization ceilings, so a single cross-fleet target usually punishes one vehicle class for the other's duty cycle. A long-haul truck's ceiling is set by hours-of-service rules; a last-mile van's is set by how many stops fit in a shift before the driver runs out of daylight or the route runs out of addresses — two different constraints that a single fleet-wide percentage target flattens into one number neither vehicle class can actually hit.
Idling is one of the most common utilization leaks because it wastes fuel while producing no productive work. According to the EPA SmartWay program, a typical Class 8 diesel truck burns about 0.8 gallons of fuel per hour while idling. Long-haul trucks may idle between roughly 1,500 and 2,400 hours per year, or about 5 to 8 hours per day over 300 operating days. That adds up to somewhere between 900 and 1,400 gallons of diesel burned annually just from idling.
Separating operationally necessary idling (a reefer unit, a PTO-driven pump) from avoidable idling (a driver keeping the cab warm at a rest stop) turns that number from an abstract percentage into a specific, budgetable cost.
Predictive Fleet Analytics: From Reactive to Proactive
Reactive maintenance waits for a warning light or a breakdown. Predictive fleet analytics uses historical sensor trends, including engine temperature, oil pressure, battery voltage, and vibration, to flag a developing failure before it strands a vehicle. The mechanism is usually a threshold or trend rule running continuously against live data: if engine temperature climbs past a set point while oil pressure falls below another, the rule fires before either value alone would trigger a dashboard alert.
"Predictive" spans a wide range of sophistication, from a simple two-variable threshold to a trained statistical model, and the ROI depends on which end of that range a fleet actually runs. McKinsey's research on digitally enabled maintenance programs found real deployments increasing asset availability by 5 to 15% and cutting maintenance costs by 18 to 25%. That's meaningfully smaller than the "up to 50%" figure that circulates in vendor marketing, which is exactly why it's the more useful planning baseline.
Building toward the sophisticated end requires historical data with enough depth to train a model against, beyond just a live feed — a fleet that only retains 30 days of sensor history cannot build a model that recognizes a failure pattern that develops over six months. That is a data-retention decision made months before the first prediction, well ahead of the modeling decision made the week of the pilot.
A fleet weighing whether to invest in the sophisticated end at all should look at its own breakdown history first: a vehicle class with frequent, expensive, hard-to-predict failures justifies the model-training investment; a vehicle class that rarely fails outside of scheduled service intervals gets most of the value from the simple threshold rule alone.
Fleet Analytics by Industry
The KPIs above generalize; the thresholds and priority order do not. A few verticals illustrate how far the same framework bends by industry.
Cold chain logistics adds a data dimension the other verticals don't need: continuous temperature and humidity readings against a product-specific safe range, because a route can be on time and fully utilized while the cargo is ruined. Fleet analytics for cold chain operations has to treat a temperature excursion as a KPI failure independent of the delivery-time KPI.
Construction and heavy equipment shift the unit of analysis from "vehicle trips" to "asset hours" — a crane or excavator often has no odometer-relevant mileage at all, so utilization is measured in engine hours against rental or ownership cost, and maintenance intervals track hour meters rather than mileage. Watch an episode of the Telematics Talks podcast about heavy machinery analytics.
Waste management fleets run dense, repetitive local routes where the interesting analytics question is rarely "Did the truck move?" and almost always "Did every scheduled stop get serviced, and does the container-fill data justify the route's frequency?" Waste and recycling fleet analytics lean on proof-of-service and compliance reporting more than long-haul KPIs like line-haul fuel efficiency.
Field service fleets care less about miles driven and more about jobs completed per technician-day, first-time-fix rate, and the gap between scheduled and actual arrival windows — utilization here means technician capacity rather than vehicle capacity, and the field service analytics stack has to join dispatch and job data to telematics to answer it.
The common thread across all four is that the KPI framework from earlier in this guide holds — utilization, efficiency, safety, compliance — but the definition of each term shifts with the unit of work. Getting that redefinition right per vertical, rather than importing a generic template, is most of what separates a useful KPI from a vanity metric.
How to Build a Fleet Data Analytics Stack
Building the stack is a sequence of four decisions, and skipping one usually shows up as a limitation two steps later.
Step 1: Choose your data sources. Inventory what each vehicle already reports — GPS, CAN-bus channels, fuel cards, driver-behavior events, and data enriched with IoT Logic, Navixy’s data processing and automation tool, — before adding hardware. A factory-connected vehicle or an existing tracker may already carry the fields a KPI needs.
Step 2: Centralize the data. A lakehouse, with raw, transformation, and business-metrics layers in one warehouse, beats a traditional data warehouse for fleet telematics specifically because raw signal volume is high and the useful shape of that data changes as new questions get asked. A rigid warehouse schema has to be re-modeled every time; a lakehouse keeps the raw layer intact and adds new transformation and business-metrics layers without touching it.
Step 3: Connect BI tools. Once data is centralized behind a standard SQL interface, tools like Power BI, Tableau, or Apache Superset connect the same way they would to any PostgreSQL database — no custom connector, no vendor-specific export format to parse.
Step 4: Define custom KPIs and dashboards. This is the step most fleets underinvest in, because it is also the step a vendor's default dashboard tries hardest to make unnecessary. A safety score, a fuel-efficiency baseline, or a utilization target is only useful when its thresholds match this fleet's vehicle mix and routes — which means someone has to write the SQL rather than select a preset.
Navixy runs this stack as IoT Query: a managed Private Telematics Lakehouse that organizes data into a raw data layer, a data transformation layer, and a business metrics layer, and exposes all three through a standard PostgreSQL connection. Fleets connect Navixy’s built-in BI tool Dashboard Studio or other third-party application (Power BI, Tableau, Looker, etc.), or a Python notebook directly, instead of scraping a rate-limited API or waiting on nightly CSV exports.
Try IoT Query — fleet data analytics platform to see Step 3 and Step 4 running against real fleet data, or start from the custom-KPI dashboards if Step 4 is the gap.
In practice, most fleets that stall at Step 2 blame the BI tool in Step 3 — the dashboard looks wrong because the model underneath it was never rebuilt for the question being asked, not because the visualization layer is weak.
Getting Started with Data-Driven Fleet Management
The first week doesn't require a platform migration. Pick one KPI that already has a known problem, whether that's excess idling, a safety-score outlier, or a persistently late route, and trace it back to its raw source data by hand. That exercise reveals, faster than any planning document, exactly which of the four stack decisions above is actually missing: a source that isn't captured, a join that doesn't exist, or a KPI definition nobody has actually written down.
The longer roadmap follows the same order as the stack itself: settle the source inventory, centralize before layering on BI tools, and treat the KPI definitions as a maintained asset that gets revisited whenever the vehicle mix or the business changes. A fleet that revisits its KPI thresholds annually catches the drift early. A fleet that never revisits them only discovers it when a number stops making sense.
Neither step requires ripping out an existing telematics provider. The source inventory in step one is meant to include what a fleet already has, and the centralization step works against whatever devices are already installed.
Book a strategy session to work through the four-step build with your own vehicle mix and data sources.
On this page
- What Is Data-Driven Fleet Management?
- Fleet Performance Analytics: KPIs That Actually Matter
- Telematics Data Analytics: Turning Raw Signals into Insights
- Fleet Data Management: Breaking the Silo Problem
- Fleet Utilization: How to Measure and Improve
- Predictive Fleet Analytics: From Reactive to Proactive
- Fleet Analytics by Industry
- How to Build a Fleet Data Analytics Stack
- Getting Started with Data-Driven Fleet Management