How to deal with faulty fuel readings without losing your mind

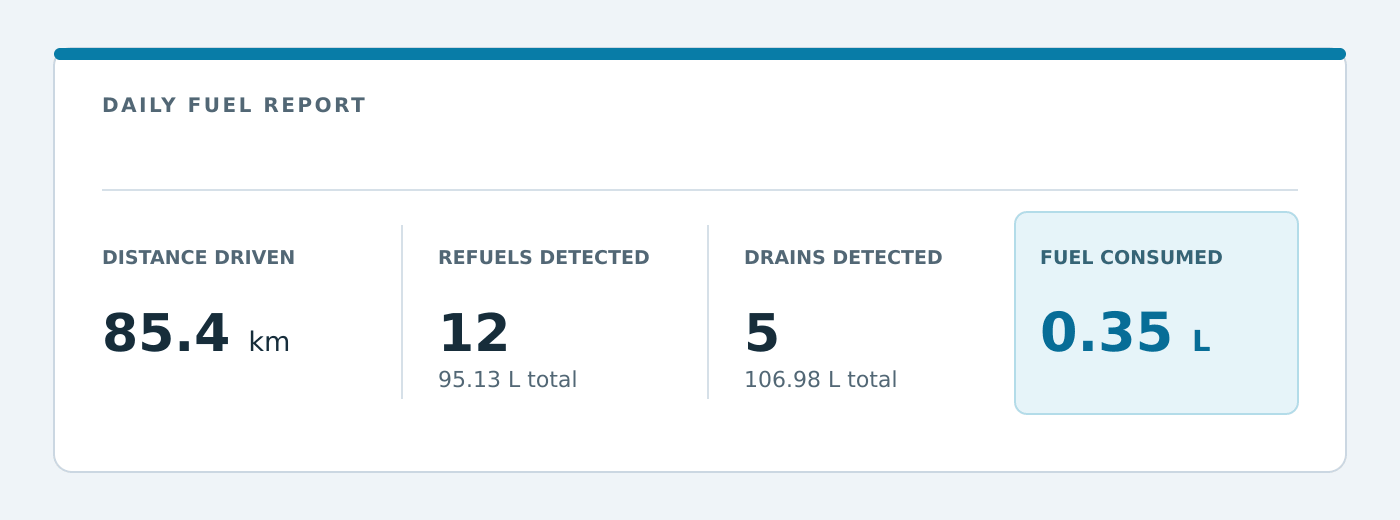
A fuel report is routine stuff. It tells you how much fuel a vehicle used and whether anything unusual happened along the way. That’s how it usually works. Now imagine opening one that says a bus refueled 12 times, drained fuel 5 times, and used just 0.35 liters over 85 km. Where would you even start?
We sifted through three days of raw tracker data, then used Navixy IoT Logic to stop bad readings from distorting the report. The same approach could help with other sensor data that occasionally turns reports and alerts into nonsense. But let’s unpack this case step by step.
A fuel report that doesn't add up
A 26-bus fleet got a fuel report that raised more questions than it answered. One of the buses supposedly drove 85 km on 0.35 liters of fuel, with 12 refuels and 5 drains along the way. That is a lot of activity for one day (and none of it actually happened).
The fuel graph showed where those events came from. Several times a day, the line dropped toward zero, stayed low for a while, then jumped back up. The platform did what it was built to do: it treated every fall as fuel leaving the tank and every jump as fuel coming in, and the alerts followed.
The math was awkwardly mathing. Fuel at the start of the day, plus refuels, minus drains, minus fuel left at the end gave 62.2 + 95.13 − 106.98 − 50 = 0.35 liters. The formula was fine. So, obviously, the readings were to blame.
The obvious fix wasn't enough to bring fuel readings back to normal
The customer suggested a simple fix. The dips seemed to start when the engine started, so they asked us to ignore fuel readings for 20 seconds after the ignition turned on. We put it in place, but the dips kept coming. Some lasted far longer than 20 seconds. Others stretched across a whole parking stop, long after the engine had gone quiet. Guessing had gone as far as it could, so we went to the raw data.
What 34,000 messages revealed
A tracker sends a steady stream of small messages: a timestamp, a position and whatever the vehicle reports. The fuel level comes from the bus's own computer, which shares it over the vehicle's internal data network, the same one that feeds the gauge on the dashboard.
We exported three days of raw data from three buses, about 34,000 messages, and went through them message by message. Three patterns explained almost everything.
1. Parked means no news
With the engine off, no fresh fuel data arrives, so the tracker keeps sending the last level it received. Across 36 parking stops of one bus, the reported fuel level did not change once. Readings taken while a bus is parked carry no new information.
2. The first minutes after a start are unreliable
Right after the engine starts, while the vehicle's systems come online, the first fuel readings are not always real. They often claimed the tank held 0 to 6 liters, whatever was actually in it. Usually this cleared within seconds. On about one start in five it took longer, and the slowest took just over 7 minutes.
3. A short start leaves a long dip
Put the first two patterns together and you get the deepest dips. A driver starts the engine and switches it off less than a minute later. The last reading the tracker received was one of those unreliable start-up values. With the engine off, that value is all it has, so it repeats it for the whole stop.
15:44:31  ignition off   fuel 24.9 L
15:44:34  ignition on    fuel  0.0 L   engine 740 rpm
15:45:16  ignition on    fuel  5.4 L   engine 744 rpm
15:45:17  ignition off   fuel  5.4 L
          276 more messages over 47 minutes, every one of them 5.4 L
16:32:33  ignition off   fuel  5.4 L
16:32:34  ignition on    fuel 21.6 L
16:35:56  ignition on    fuel 25.3 L   driving at 45 km/h
One bus, 43 seconds of engine time, then 47 minutes of a tank that looked almost empty. These are the tracker's raw messages, exactly as it sent them.
In the report, that one stop looks like about 20 liters taken out of the tank and about 20 liters put back 47 minutes later.
Real refuels got scrambled too. On one bus, the refuel happened between several short engine starts, and a single refuel of about 30 liters showed up on the graph as a plunge to nearly zero followed by a climb to 62 liters.
So, why didn't the simple fix work?
Most fuel settings look only at the numbers. Each of them fails here in its own way.
| Approach | What happens with this data |
|---|---|
| Smooth or average the readings | The noise gets blended into real values. A 47-minute stretch of 5.4 L drags the average down, so the false dip gets softer and stays. |
| Ignore readings below a limit | A tank that really is nearly empty gets hidden too. Noise above the limit, like the 15 to 18 liter readings we found, still gets through. |
| Raise the alert threshold | Fewer alerts, but the fuel graph and the consumption report stay wrong. |
| Rules that know the context | IoT Logic checks what a person would check. Is the engine running? How long ago did it start? Does the new value hold? Noise is dropped, and real refuels and drains stay. |
The 43-second engine run is the giveaway. To reject the 5.4 L reading, the flow needs to know what the bus was doing when the tracker received it. A rule based on the fuel number alone cannot tell a bad reading from a nearly empty tank.
Four questions, asked of every reading
IoT Logic sits between the trackers and everything that uses their data: maps, reports and alerts. You build a flow on a visual canvas by connecting blocks. Some blocks check a condition and others calculate a new value. Formulas inside them can look back at earlier messages and at the exact time each message was recorded on the vehicle. Every message passes through the flow, and the platform sees only what comes out the other end.
Our flow asks each fuel reading up to four questions, in order.
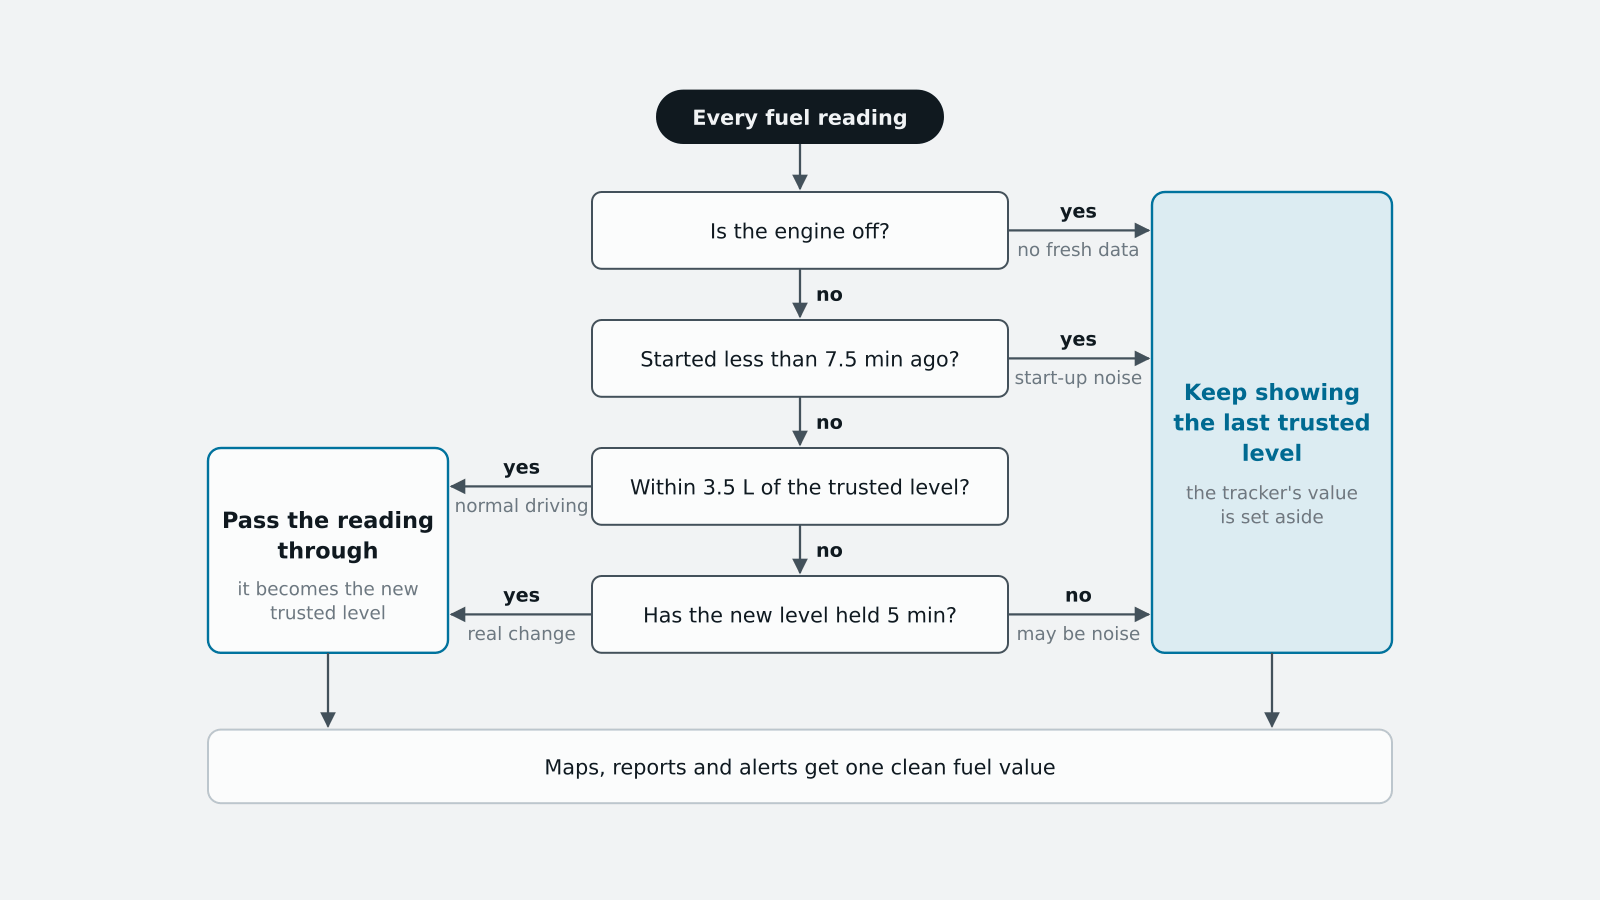
The flow keeps the last trusted level until a reading passes the checks.
The fuel readings took just over 7 minutes to settle after the slowest start in the recorded data, so we set the warm-up period to 7.5 minutes. During normal driving, the level never changed by more than 3.5 liters between two messages, which also matched the threshold the customer asked for. We chose 5 minutes because no noisy reading in the recorded data held steady that long with the engine running, while the levels after real refuels and drains did.
These checks mean a refuel or drain can take up to about 12 minutes of engine running time to show up in the report. The flow waits for the warm-up period and checks that the new level holds before passing the reading through.
The flow writes the cleaned level back into the same field the fuel sensor already reads, so graphs, reports and alerts pick it up automatically. When first switched on, it leaves readings unchanged until it has seen one clean reading after a full warm-up. That prevents it from creating a false event if it starts processing data in the middle of a bad parking stop.
One afternoon, before and after
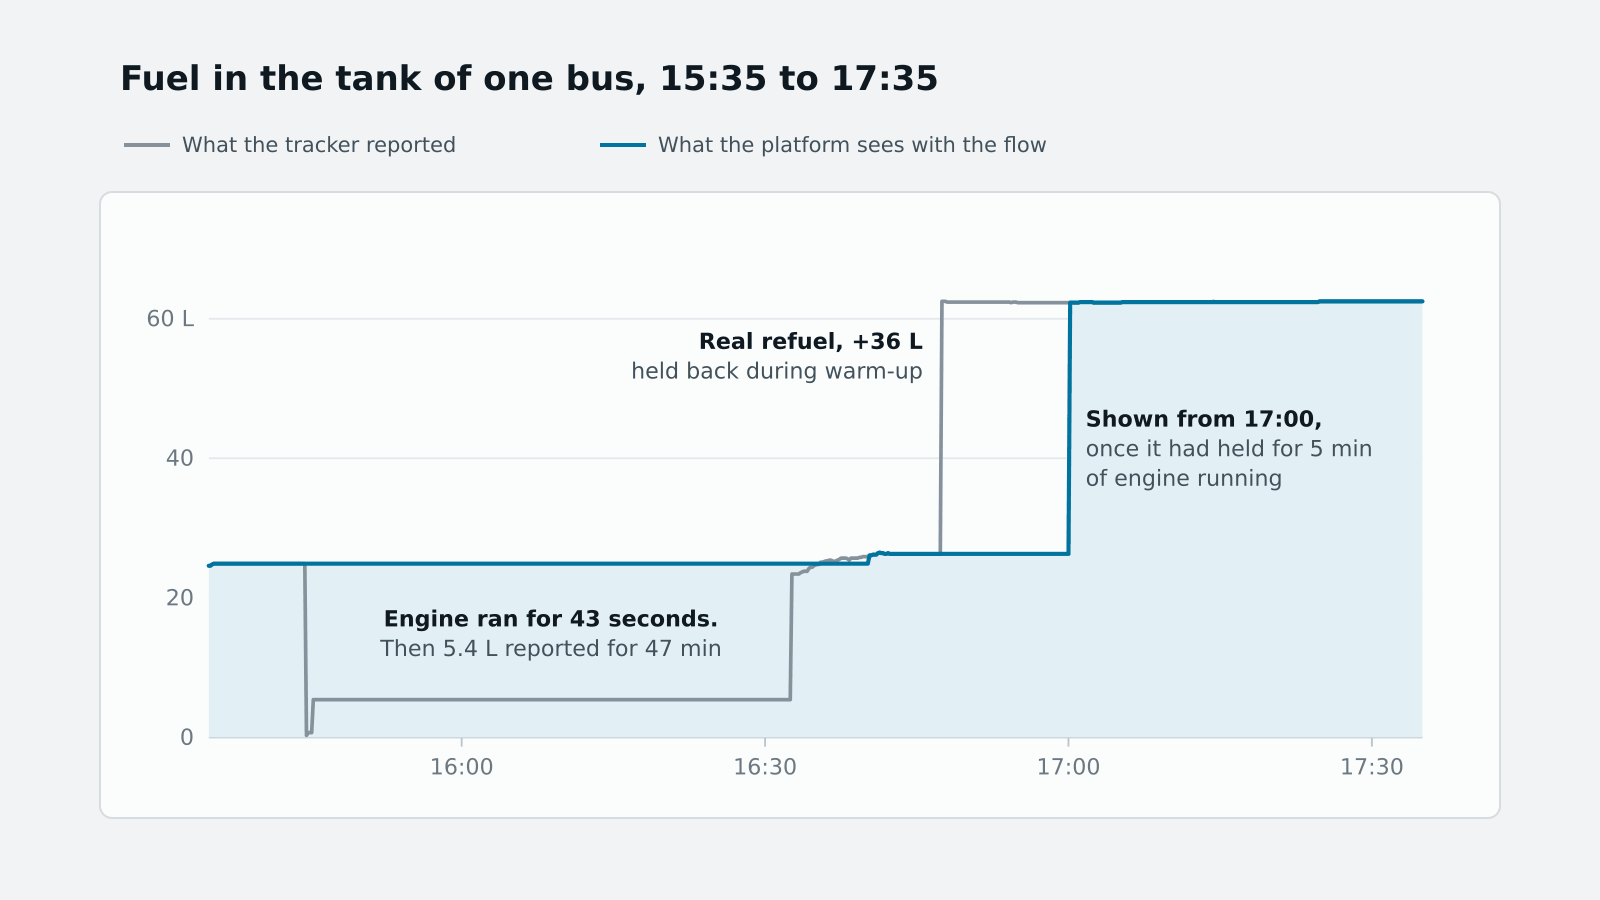
The tracker's recorded data for one afternoon, replayed through the flow. The gray line shows only where the two disagree.
| Time | Tracker reported | Platform sees | What happened |
|---|---|---|---|
| 15:44:31 | 24.9 L | 24.9 L | Parked |
| 15:44:34 | 0.0 L | 24.9 L | Engine starts, and the first reading is noise |
| 15:45:17 | 5.4 L | 24.9 L | Engine off after 43 seconds. The tracker keeps its last reading |
| 16:32:34 | 21.6 L | 24.9 L | Next start, 47 minutes later. The warm-up window begins |
| 16:40:44 | 26.2 L | 26.2 L | Warmed up, and readings are trusted again |
| 16:47:23 | 62.5 L | 26.3 L | Refuel, right after a new start, so it waits |
| 17:00:10 | 62.3 L | 62.3 L | The new level held for 5 minutes of engine running, so it is accepted |
How we made sure it works
Before the flow touched a real bus, it ran against virtual trackers that replayed the fleet's worst moments: the 47-minute dip, a refuel in the middle of several short starts, fuel stolen while driving, readings dropping to zero mid-trip, and switching the flow on during a bad parking stop. All nine test scenarios passed. Then it ran on a real tracker on our test bench.
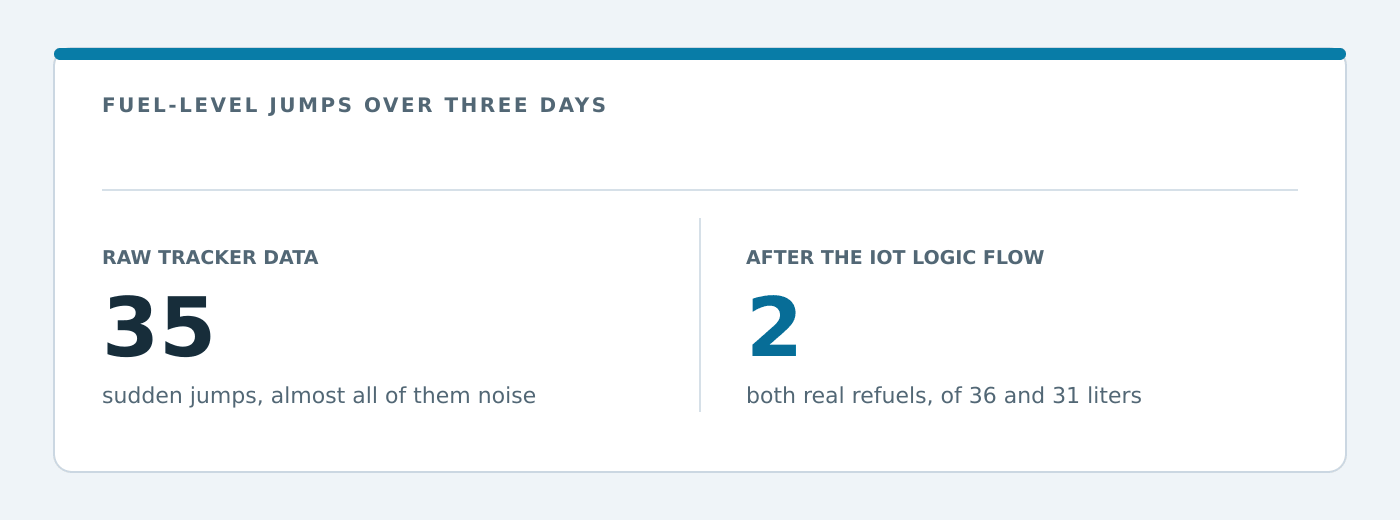
We also replayed all of the recorded data, about 34,000 messages from three buses over three days in August 2026, through the same rules and counted sudden jumps of more than 3.5 liters from one message to the next. For two of the buses, the flow told whether the engine was running from engine speed.
Deploying it takes one file. Upload the flow, choose the vehicles and switch it on. There are no visits to the vehicles and no changes to trackers, sensors or alert rules. Turning the flow off lets the platform use the raw readings again.
The same idea works far beyond fuel
The underlying pattern is common: a value that can be trusted only under certain conditions. The flow in this case checked ignition state, time since the start and whether a new level held. Other troublesome readings can be checked against the conditions that make sense for them.
- Speeding alerts caused by GPS jumps. Count a vehicle as speeding only when enough satellites are in view and the speed stays high for 10 seconds.
- Sensors that need a warm-up. Ignore temperature or pressure readings for the first minutes after a device powers up.
- One-off spikes. Accept a new value only after it repeats or holds for a set time.
Those conditions can be applied before a reading reaches reports or alerts. In this case, that meant a 43-second engine run no longer looked like a fuel drain followed by a refuel, while changes that held long enough still came through.
To build flows in IoT Logic, start with the IoT Logic documentation. If you're wondering how the approach would fit your fleet or your sensors, get in touch with our team.