How to get Trips reports you need with Navixy flexible fleet analytics

AuthorAndrew M., VP of Data and Solutions
Every time your company's vehicle goes somewhere, a GPS tracking platform automatically writes down the full story of that trip: where it started, where it went, where it stopped, how fast it drove, and how long it was on the road. All of it lands in one report you can open, filter, and act on. That record is a trip report — and in the Navixy telematics platform, it's the foundation of every fleet decision.
For example, your GPS devices logged over 47,000 coordinate points last week. Your accountant wants mileage for reimbursements. Your customer claims a delivery never arrived. Your driver says he worked until 9 PM, but you're not sure. Somewhere in those more than 47,000 points are the answers, but only if you know how to extract them.
Fleet trip reports have evolved beyond simple "where was the vehicle" logs. For fleet owners managing 40 or more vehicles, they've become an operational evidence layer. They answer the questions that matter:
- Was the driver actually at the client site?
- Why did the delivery take three hours instead of one?
- Which vehicles are earning their keep, and which are sitting idle?
Companies that use trip reports well treat trip data as business intelligence. Companies that don't treat it as a historical curiosity. Explore full capabilities of trip reporting with Navixy.
The five jobs fleet trip reports actually do
Trip reports serve specific roles for specific people in your organization. Understanding these jobs helps you extract value instead of drowning in data.
Maintaining discipline and preventing personal use
Fleet managers need to know if company vehicles are being used for personal errands, unauthorized trips, or weekend family visits. Trip data reveals patterns that employee self-reporting never would. When every trip is recorded with start time, end time, route taken, and stops made, the conversation about vehicle policy becomes data-driven rather than accusatory.
Calculating working hours and compensation
Accountants and safety managers use trip data to reconcile driver timesheets. When a driver claims 12 hours but the trip log shows the vehicle parked at 4 PM, you have a factual basis for the conversation. For field technicians and social workers who receive mileage compensation, trip reports provide the audit trail that finance departments require.
Proving service for customers
Last-mile delivery operations live and die by proof of service. When a customer disputes a delivery, GPS timestamps showing arrival at their geofence, time spent on-site, and departure time become evidence that settles the argument. GPS timestamps are increasingly used in legal disputes as documentary evidence.
Detecting route deviations
Coordinators and dispatchers use trip data to understand why things went wrong. A delivery that took two hours instead of 45 minutes might reveal a driver who stopped for lunch, hit unexpected traffic, or deviated to an unauthorized location.
Tracking mileage for amortization and billing
For companies that charge clients based on miles driven or need to calculate vehicle depreciation, trip reports provide the hard numbers. No estimation, no guessing. Just actual distance traveled, verified by GPS.
New approaches to fleet trips reports at Navixy: from quick glance to deep fleet analytics
Not every question requires the same level of investigation. Navixy structures trip reporting in three tiers, each serving different needs without forcing unnecessary complexity on users who just need a quick answer.
| Level 1. Built-in Dashboard (new) | Level 2. Dashboard Studio | Level 3. Custom app on IoT Query | |
|---|---|---|---|
| Reach for it when | You need a daily fleet health check | You need custom KPIs or shift-level breakdown | Standard tools can't answer your specific operational questions |
| Primary users | Fleet managers, company owners | Operations managers, dispatchers | Built by system integrators per client spec |
| Setup | None — works out of the box | Template customization, no coding | Custom development project |
| Typical questions answered | Did all vehicles run? Any idle assets this week? | Which shift underperforms? Who's accumulating speed violations? | Did refrigeration hold temperature? Was this trip suspicious? |
| Data window | Rolling 7 days | Configurable | Configurable |
Level 1. Spot anomalies before the daily meeting with built-in Dashboards (new)
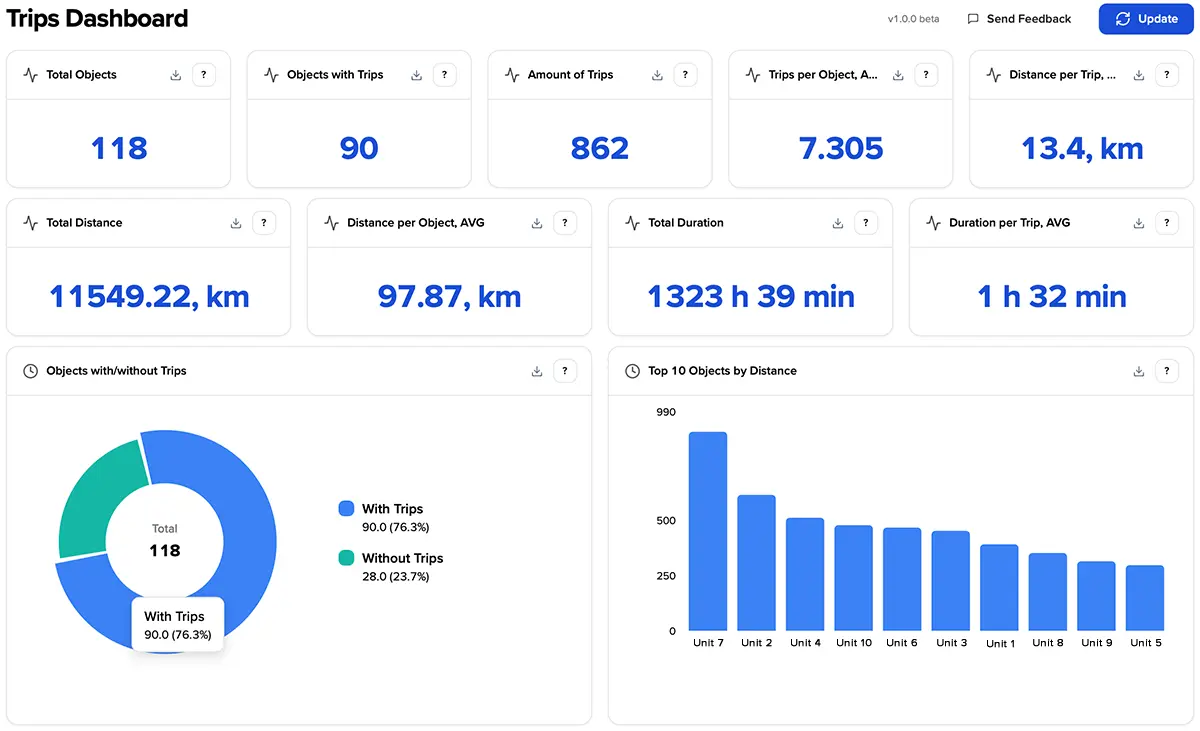
Navixy's Dashboards (new) app is built around one idea: a complete trip overview at a glance, with no report analysis required. It displays necessary surface-level KPIs: minimum, maximum, and average distance traveled; trip duration summaries; trip counts by vehicle; and which vehicles had trips versus which sat idle. All figures cover a rolling seven-day window, so anomalies surface without searching — a vehicle showing zero trips on Tuesday stands out the moment you open the screen. A fleet manager starting Monday morning can see at a glance whether last week's operations were normal or if something needs investigation.
Level 2. Customize your KPIs without writing a line of code with Dashboard Studio
If you need more than a standard dashboard but don't want to build from scratch, Dashboard Studio on a foundation of IoT Query is available directly in Navixy. It's an embedded data visualization tool with two pre-built Trip report templates you can adapt to your own KPIs — adjust metrics, change time windows, and make the data work the way your operation actually runs.
Trip Operations Dashboard splits trip data by day shift (08:00–19:00) and night shift (19:00–08:00), comparing yesterday's figures against the seven-day trend. It flags anomalous trips — those under five minutes or over eight hours — and tracks speed violations above 75 mph (120 km/h). Built for fleets where shift discipline and speed compliance are the primary concern.
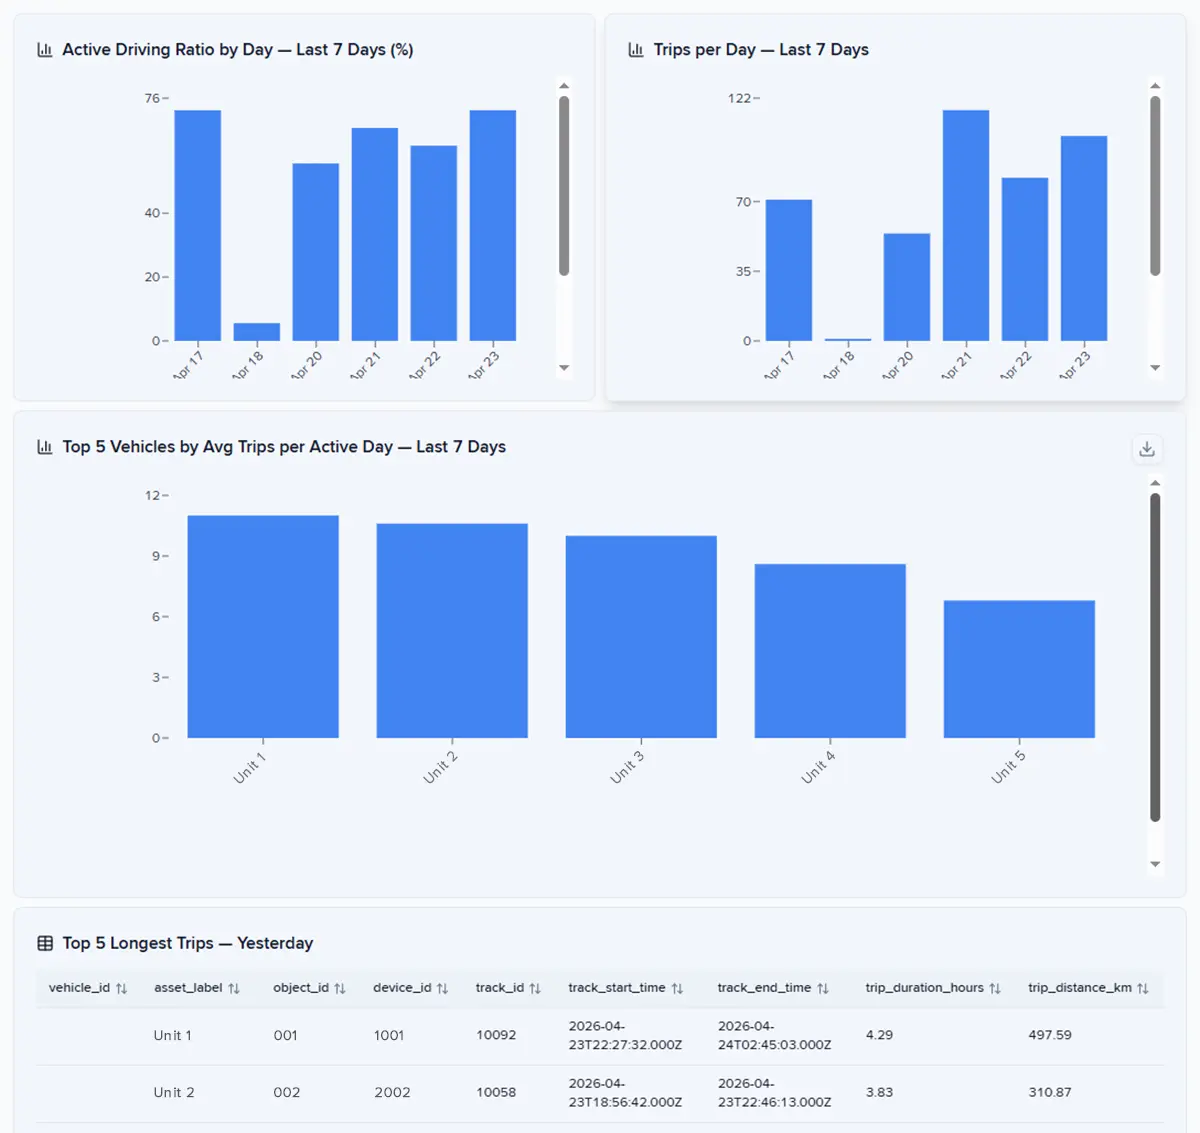
Trips Dashboard (Yesterday) gives a full picture of the previous day: total trips, mileage, and drive time broken down by hour; top vehicles by distance and trip count; speed compliance distribution; and top origin-destination pairs. A Zone Retention Rate shows what share of trips both started and ended inside defined geofences — a quick read on route discipline across the fleet.
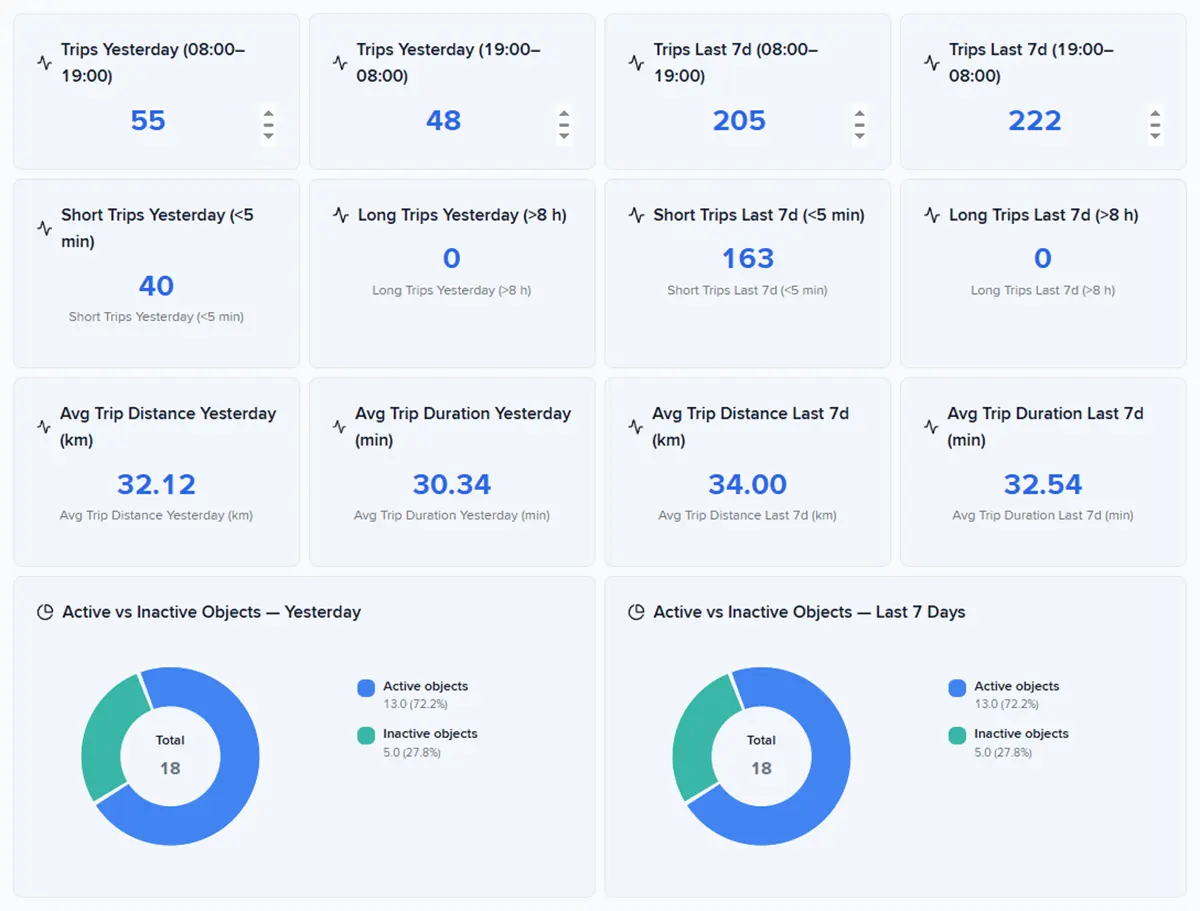
Operations managers use this level to spot emerging patterns: "Are Monday trips consistently shorter than Friday trips?" or "Which drivers are accumulating speed violations?" The templates work out of the box, or can be adjusted to match your specific business processes without starting from scratch.
Level 3. Build exactly the analytics you need using IoT Query
If the business requires analytics that standard reports can't deliver, you can build a custom solution from scratch using the IoT Query dataset. You can also check Dashboard Studio code, as this open-source Navixy application available on GitHub, that gives you a working foundation so you're not starting from zero.
One of our partners, a system integrator, received a request from a client shipping pharmaceutical cargo. Standard reports couldn't answer the questions that mattered: Did refrigeration hold temperature during transit? Did drivers stay within approved route corridors? Were doors opening at unauthorized stops? The partner built a custom analytics application on top of Dashboard Studio and Navixy's IoT Query database. That application is Trips Intelli.
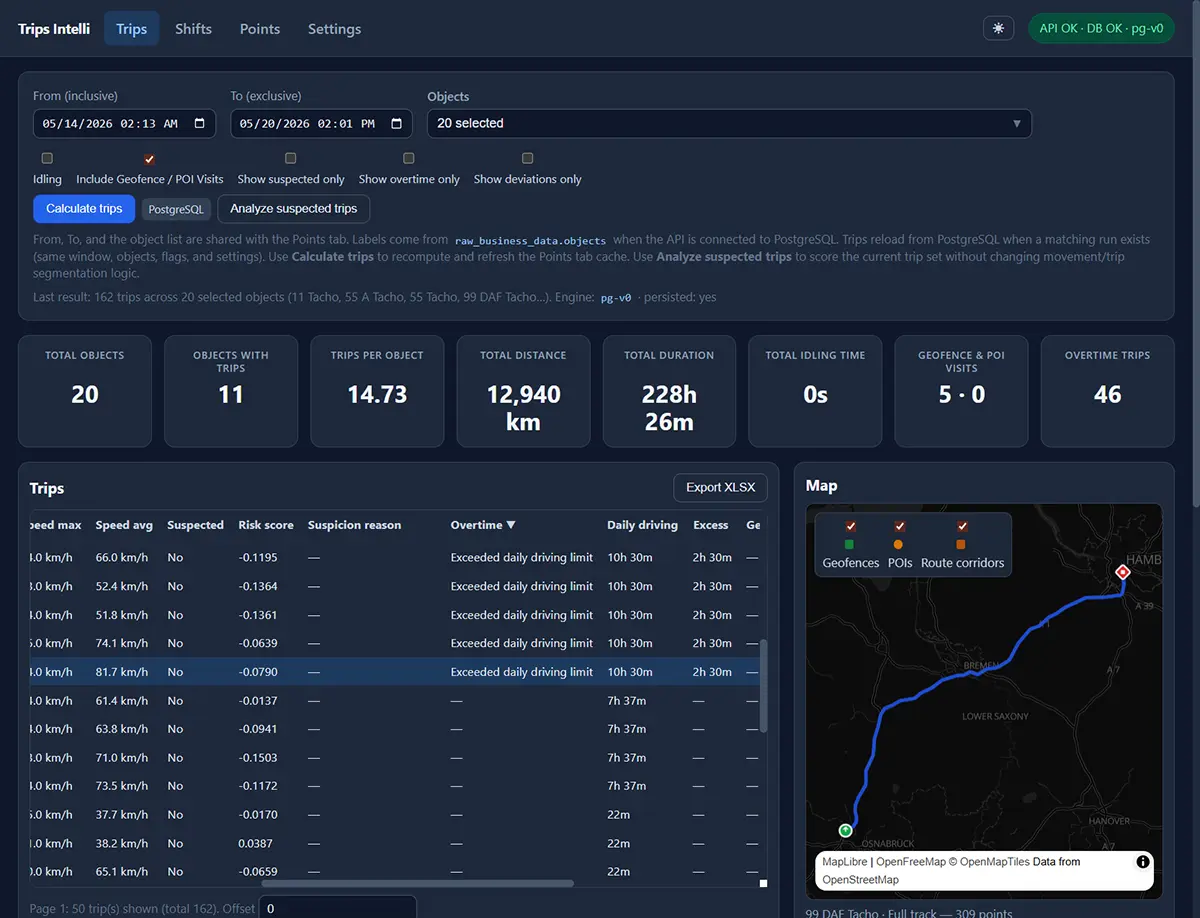
It provides an interactive trip table with map and activity timeline, route corridor compliance checking with deviation classification, overtime and out-of-schedule detection, sensor threshold alerts for temperature and fuel levels, door state monitoring, and ML-based anomaly flagging that assigns each suspicious trip a risk score and a plain-text explanation — "Out-of-shift / night-time" or "Unusual duration." Full timeline reconstruction lets investigators correlate location, sensor readings, and door events in a single view. All data exports to XLSX with one click.
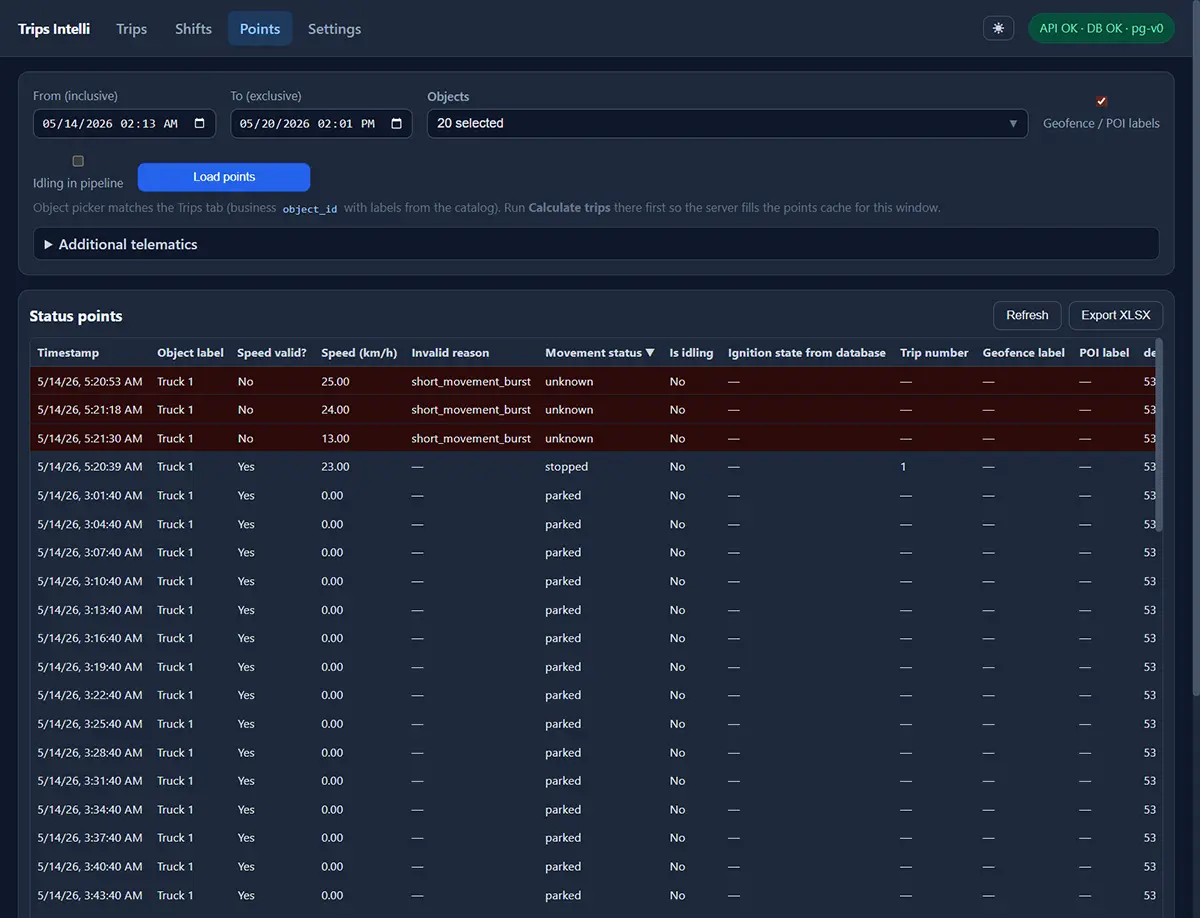
Each level of trip reporting in the Navixy telematics platform builds on the previous rather than replacing it. Most daily operations stay at the built-in Dashboard or templates in Dashboard Studio. Trips Intelli, and custom applications like it, exist for when something doesn't look right and the data needs a closer look.
Real scenarios: trip reports in action
Morning operations check
It's Monday at 8 AM. You open the dashboard and see that across 18 vehicles, your fleet covered 84,176 kilometers last week with 150 hours of driving time. Roughly normal. But one vehicle shows zero trips for three consecutive days. Is it in the shop? Assigned to a driver on leave? Or did someone forget to dispatch it? The KPI panel flags the anomaly; your job is to investigate.
Overtime investigation
Company policy says vehicles shouldn't be used after 7 PM without authorization. The Trips Intelli (or your own application) analysis flags three vehicles with repeated late-night activity. Drilling into the data, you see short trips between 10 PM and midnight, routes that don't match any customer locations. The "out-of-shift" flag highlights these for review. The conversation with those drivers now has a factual foundation.
Route compliance verification
Your insurance requires drivers to stay on approved corridors. A delivery that should follow the highway instead cuts through a residential zone with lower speed limits. The corridor adherence percentage drops from 98% to 67% for that trip, and the system logs the deviation segments. You know exactly where the driver went off-route and for how long.
Cold chain integrity
A pharmaceutical delivery requires maintaining temperature between 2°C and 8°C (36°F–46°F). The trip timeline shows temperature sensor data alongside location data. When the temperature spikes to 12 degrees during a 45-minute stop, you can correlate it with the trip segment to understand what happened. Was it a door left open? A refrigeration unit failure? The evidence is in the timeline.
How to shift from data points to decisions
Companies that get real value from trip reporting match the level of analysis to the question at hand. Quick checks stay simple, while deeper investigations uncover issues like unauthorized vehicle use, route manipulation, or other unexpected patterns. The Navixy’s three-level approach to essential fleet analytics described above — from dashboard KPIs to custom analytics powered by IoT Query and proprietary logic — lets businesses scale from daily monitoring to advanced operational intelligence without unnecessary complexity.
Contact sales to explore which level of Navixy telematics platform trip analytics matches your operations.
Frequently asked questions about Trip reports in Navixy
Q.: Who uses trip reports in a fleet operation?
A.: Trip reports serve different roles at different frequencies. Fleet managers check daily for utilization rates and anomalies across the whole fleet. Dispatchers pull them up the moment a customer calls. Accountants need clean mileage exports at the end of the month. Warehouse supervisors want one number: did the truck arrive on time. Owners and directors rely on exception alerts rather than opening reports themselves. The common mistake is building one report that tries to serve everyone; it usually ends up serving no one.
Q.: Do I have to check trip reports manually every day?
A.: Checking trip reports manually every day is not necessary. Set up automated reports to land in the right inboxes at the right time: a morning summary for the fleet manager, a weekly mileage export for finance, exception alerts for whoever needs to act. The data should come to the person, not the other way around.
You can also connect Navixy AI Assistant directly to your Navixy account and ask it questions in plain language — it pulls the data you need and answers on the spot, without opening a single dashboard.
Q.: How reliable is GPS trip data?
A.: GPS trip data is reliable enough to act on, but not perfect. Drift, signal gaps, and urban canyons can produce short phantom trips or location jumps near parking structures. Treat unusual findings as signals worth investigating, not conclusions. Verify before acting.
Q.: How do I configure trip reports to fit my specific fleet?
A.: Configuring trip reports for your fleet means overriding the defaults, which assume an average operation. Adjust short-trip filtering to cut out parking lot movements and GPS drift. Set shift boundaries based on your actual operating hours. Define speed thresholds that reflect your roads and your policy — generic limits will flag the wrong things. Apply KPI’s in Dashboard Studio and see the results.
Q.: How do I start building a custom trip analytics application on Navixy?
A.: Building a custom trip analytics application on Navixy starts with enabling IoT Query — direct PostgreSQL access to your full telematics dataset. Then fork Dashboard Studio from GitHub and use it as your foundation rather than starting from scratch. Navixy provides ready-made SQL query examples for the most common fleet scenarios. For production scale, connect Power BI, Apache Superset, or Streamlit directly to your IoT Query database.