Vehicle health and conditions monitoring: finding the next vehicle to inspect

AuthorAlex S., Senior Data Engineer

Technical condition checks often begin with several small signals rather than one definitive alarm. A change in board voltage, weaker GPS fix quality, a new active fault code, or an odometer reading that needs review can each tell a fleet manager which vehicle to inspect next.
The Technical Conditions Dashboard puts those signals in one screen. The drift ladder is a reading sequence for the fleet manager: read the current value and displayed status, use the average, trend, or other context shown in the panel, confirm reporting continuity, and investigate the selected vehicle with the maintenance team.
You'll find it inside Dashboards, the free app with three ready-to-use views: Fleet Live Status, Trips, and Technical Conditions. The app is currently in beta and available to main accounts only. Dashboard versions and calculation logic may change as Navixy incorporates feedback.
Start with the signal, then verify the data
Technical Conditions brings four documented signal groups together for fleet-wide review:
- GPS fix and quality
- Board and power-supply voltage trends
- Odometer and mileage readings
- Active fault codes from the vehicle's OBD interface
The drift ladder gives those signals a common reading order. Start with the current value and displayed status. Where the panel shows an average, trend, deviation, chart, or dated context, use it to understand what drew attention. Then verify that reporting continued and open the vehicle for investigation.
Treat reporting continuity as a gate before interpreting any status. An absent row or a stale reading does not establish that the vehicle is healthy. Confirm that the tracker is sending current data, check when the last usable reading arrived, and then decide whether there is current evidence for a technical check or only a gap in observation.
Record the observation time with the status so the maintenance team knows which reading prompted the handoff. This keeps “no data” separate from Normal and prevents the maintenance queue from being ordered around an incomplete feed.
Each field narrows the next check
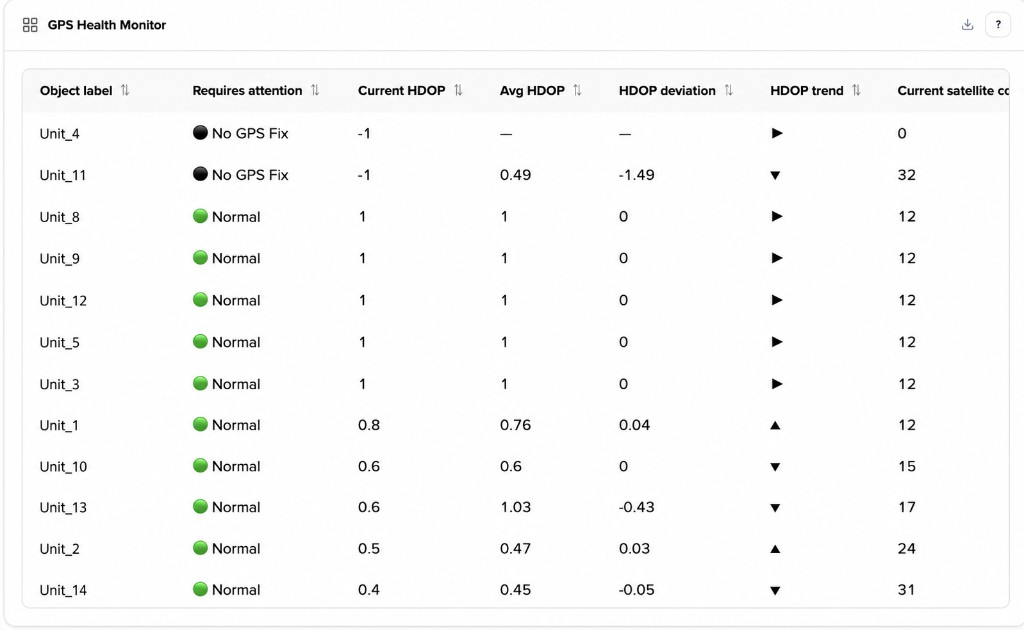
GPS fix and quality show whether the tracker is maintaining reliable positioning. The GPS Health Monitor exposes fields such as the current GPS state, HDOP, and satellite count; the screenshot also shows Normal and No GPS Fix. Use the displayed state as the starting point, check reporting continuity, and inspect the antenna and installation when the available data warrants a physical check.
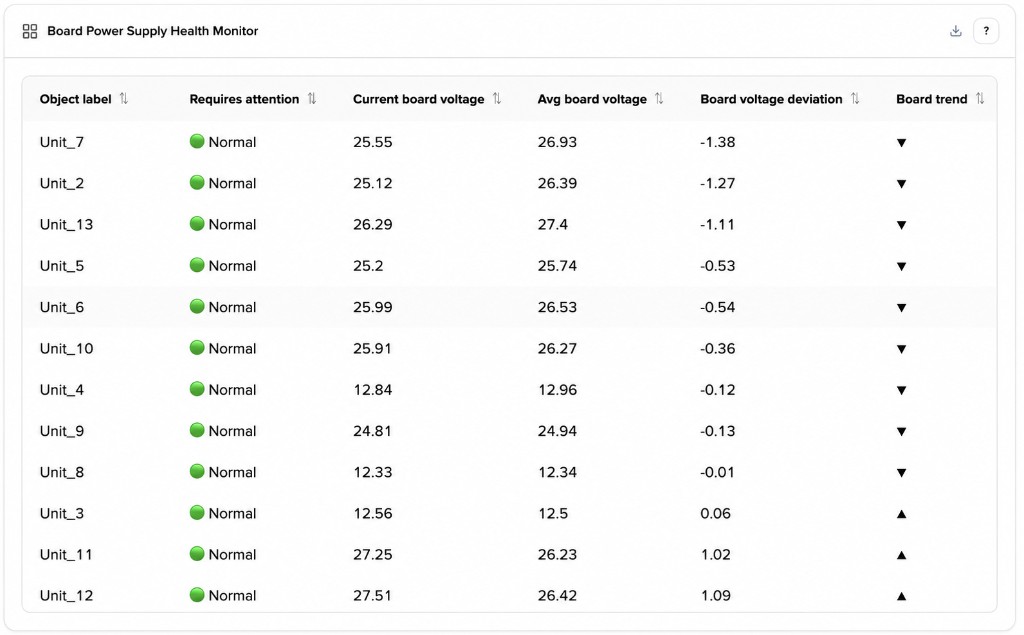
Board and power-supply voltage trends show current voltage, average voltage, deviation, and a trend arrow in the monitor. Read those displayed fields together before deciding whether the vehicle's power and charging system needs inspection. The maintenance team uses the reported context to plan the check and determines the cause during the physical inspection.
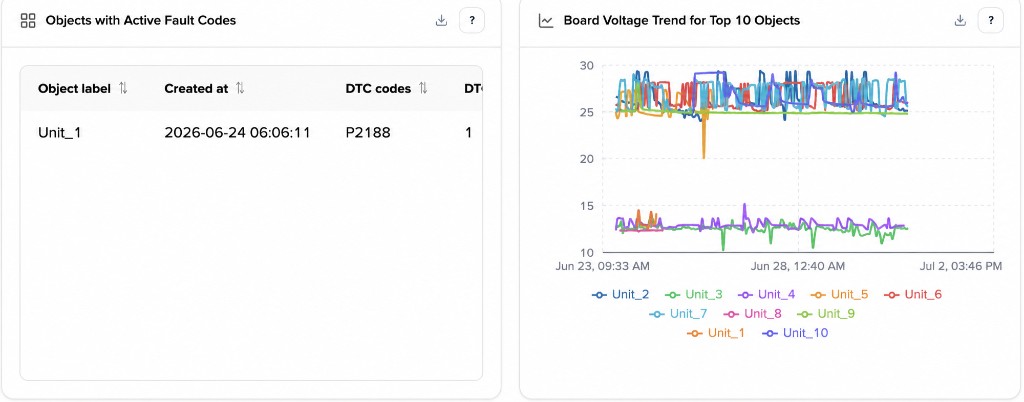
Active fault codes come from the vehicle's OBD interface. Code P2188, for example, means the engine is running too rich at idle. That meaning helps the maintenance team choose its diagnostic procedure without naming the failed component. The code flags the problem; a technician finds the cause.
Odometer and mileage readings provide service-planning context beside the hardware signals. Use the current reading to check the vehicle against the fleet's own maintenance schedule.
Taken together, the four groups frame a specific maintenance handoff. Mileage can change service priority, an active DTC supplies a code for the diagnostic procedure, and GPS or voltage fields identify the system that deserves inspection. The fleet manager can now place the vehicle in the right queue with the supporting reading attached, while the technician remains responsible for diagnosis.
From alert to action
The Latest Diagnostics table consolidates GPS quality, power-supply readings, mileage, and active DTCs by vehicle. The GPS Health Monitor and Board Power Supply Health Monitor add visible state, average, deviation, trend, and chart context where those fields are shown. Together they support triage: the dashboard surfaces the drift; it does not forecast the day something fails.
When a visible value or status draws attention, record the vehicle, current signal, displayed context, and observation time before opening other reports. Confirm the latest reading is current enough for the check, review the available chart or preceding values for continuity, and look for another documented signal that changes the maintenance priority. A DTC and an odometer reading can justify a different queue position from a GPS-quality concern alone, but neither combination identifies the failed part.
Use each flag to frame the next check:
- A vehicle is missing from Latest Diagnostics: check whether reporting has resumed, then review device power, wiring, and the signal path.
- The Board Power Supply Health Monitor shows a voltage value, deviation, or trend that needs review: inspect the vehicle's power and charging system.
- A vehicle appears in Objects with Active Fault Codes: read the code, assign the appropriate diagnostic procedure, and let the technician establish the cause.
- The GPS Health Monitor shows No GPS Fix or another state that needs review: confirm reporting, then check the antenna and installation when the data supports an on-site inspection.
For a compact daily routine, scan the values and displayed states that need review, verify reporting continuity, and hand the selected vehicles to maintenance with the signal and current reading attached. During a weekly review, look back at completed checks: which fields led to an inspection, which were reporting gaps, and which vehicles still need follow-up. Use that record to improve triage order and handoffs for the next review.
For the other two views, read the companion guide to the Dashboards app.
Use the dashboard to prioritize inspections
The Technical Conditions Dashboard organizes current and recent signals so operators can prioritize the vehicles that need inspection. Maintenance planning stays in the fleet's maintenance process, and technicians establish the cause during inspection.
Check whether the Dashboards app is available in your main account. For custom KPIs, review the Dashboard Studio and IoT Query documentation. Then open one flagged vehicle and inspect it with your maintenance team.