Turn logistics analytics into measurable margin gains
Transportation logistics analytics that connects trips, dwell, routing, fuel, and service exceptions in one view — protect SLAs, cut avoidable cost, and stay ahead of daily disruption.
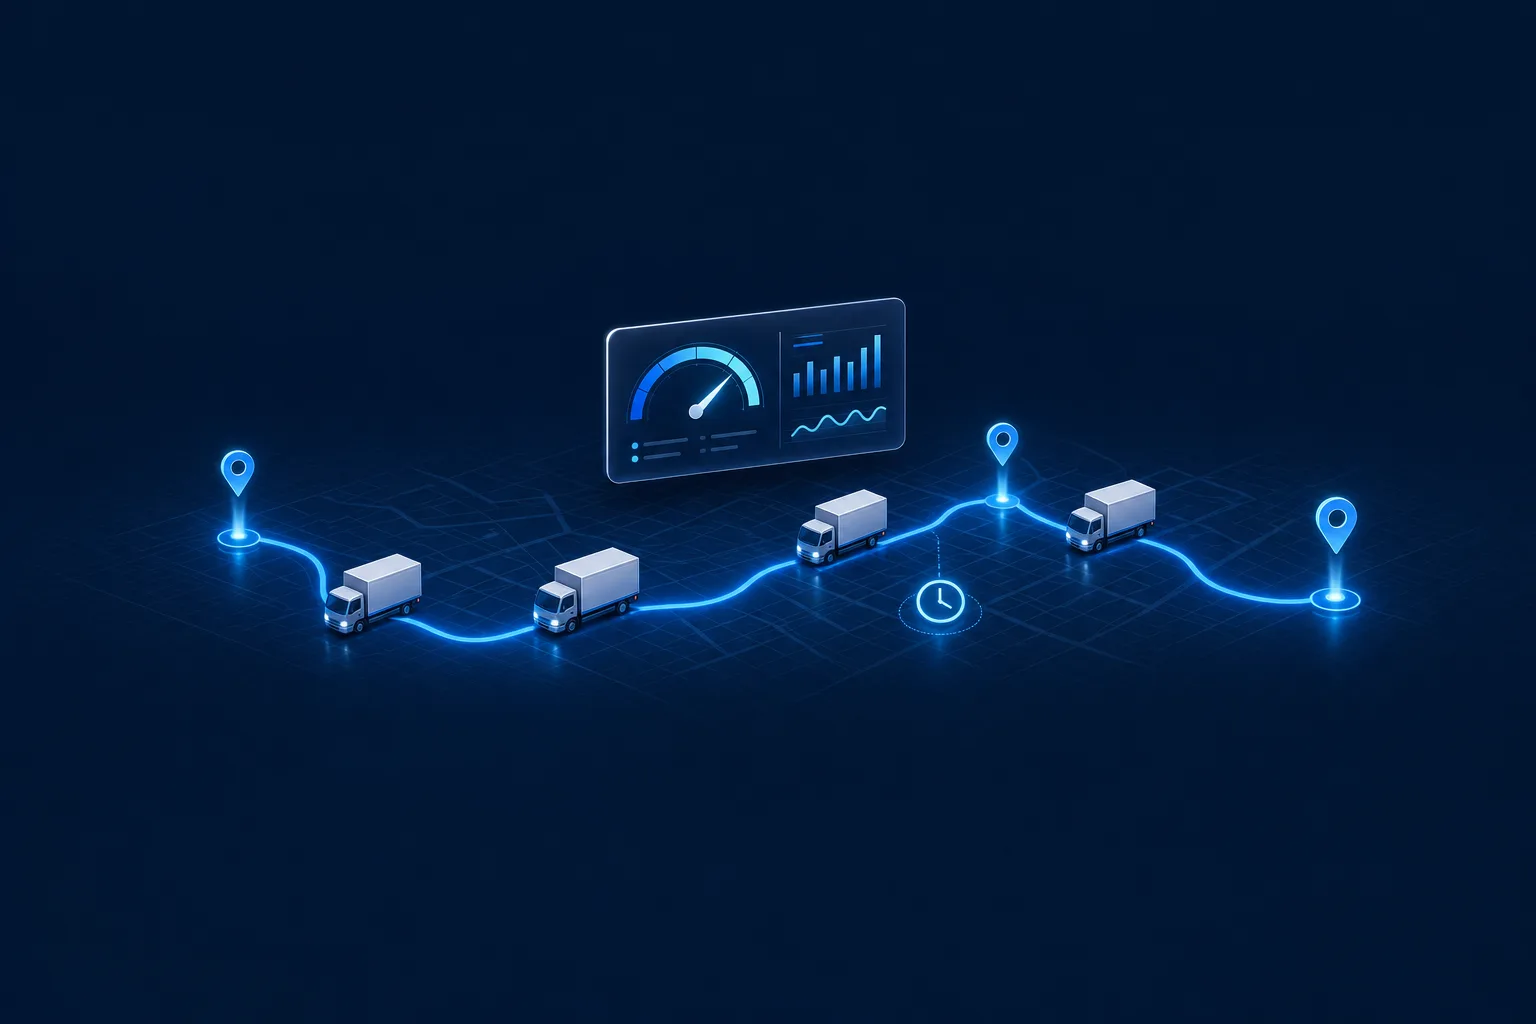
How IoT Query transforms logistics analytics
From fragmented reports to a single SQL-powered decision center for your entire network.
One number every region agrees on
Define metric logic once in SQL and propagate it to every region, depot, and dashboard. No more mismatched spreadsheet definitions or disputes over whose numbers are right.
Problems surface the same day
Route deviations, SLA exceptions, and fuel anomalies appear in your dashboards the same day they occur — not in a Monday morning report when the cost has already been absorbed.
Cost forecasts built on actuals
Predict fuel spend, cost per route, and underutilization trends using your real historical telematics data — not industry benchmarks or static budget models.
How teams get started
Define your KPIs
Set baseline cost, SLA, and efficiency metrics in SQL — aligned across every region and business unit.
Connect your BI stack
Plug Power BI, Tableau, Apache Superset, or Dashboard Studio into your IoT Query PostgreSQL endpoint.
Standardize every region
Roll out shared metric definitions to all depots, routes, and customer contracts — one source of truth.
Automate refresh and alerts
Schedule dashboard refreshes, cost summaries, and anomaly alerts so operations teams always see current data.
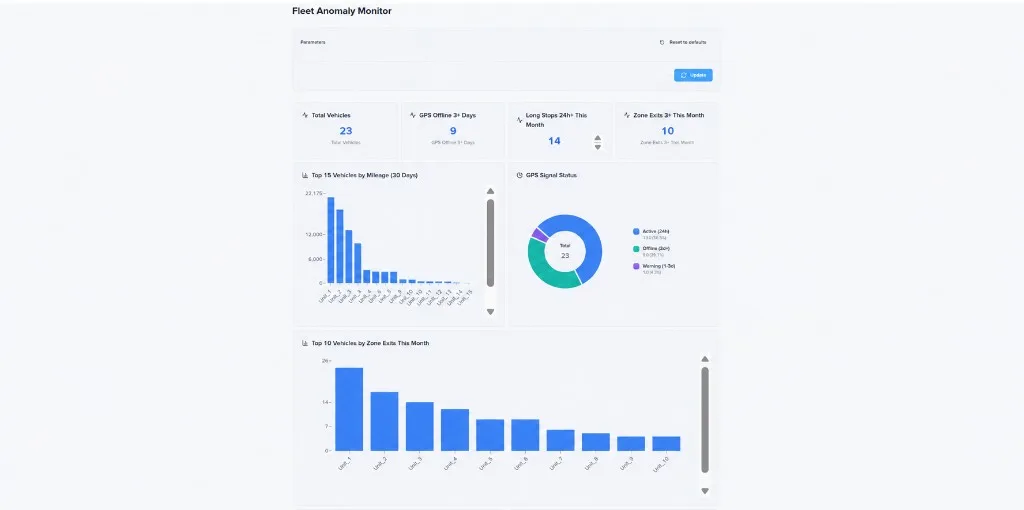
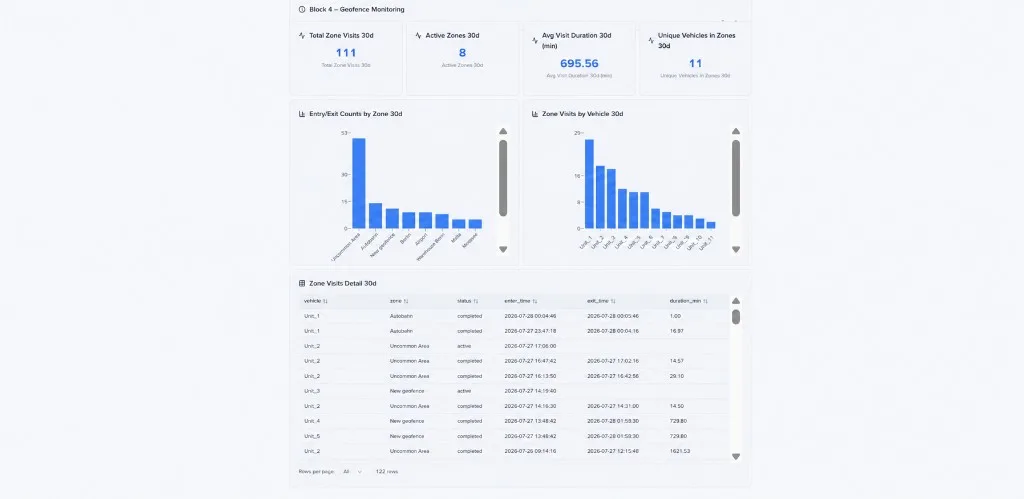
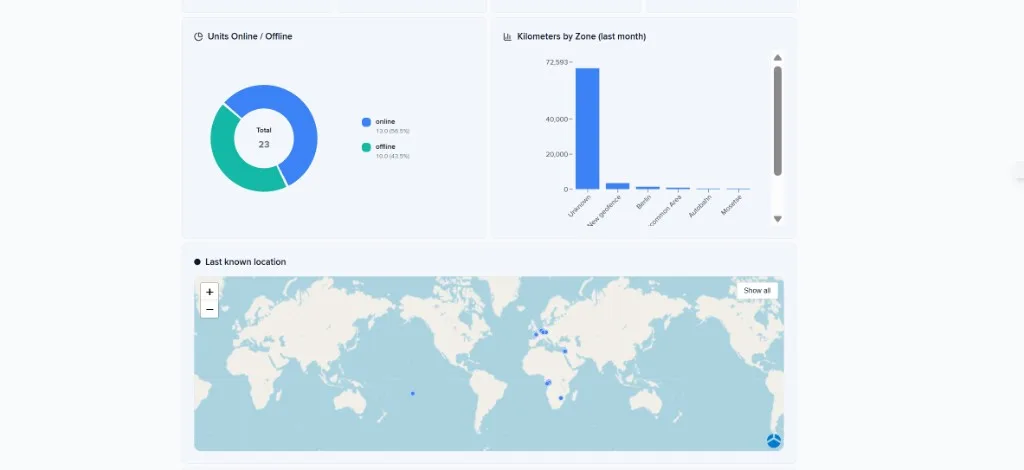
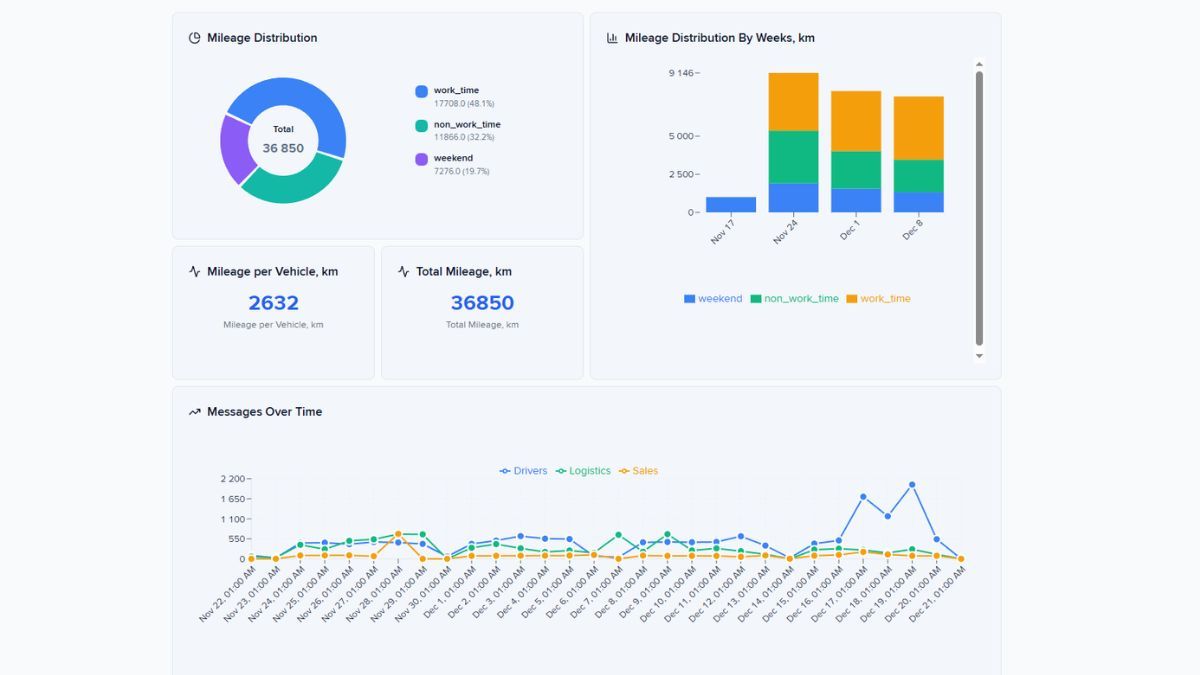
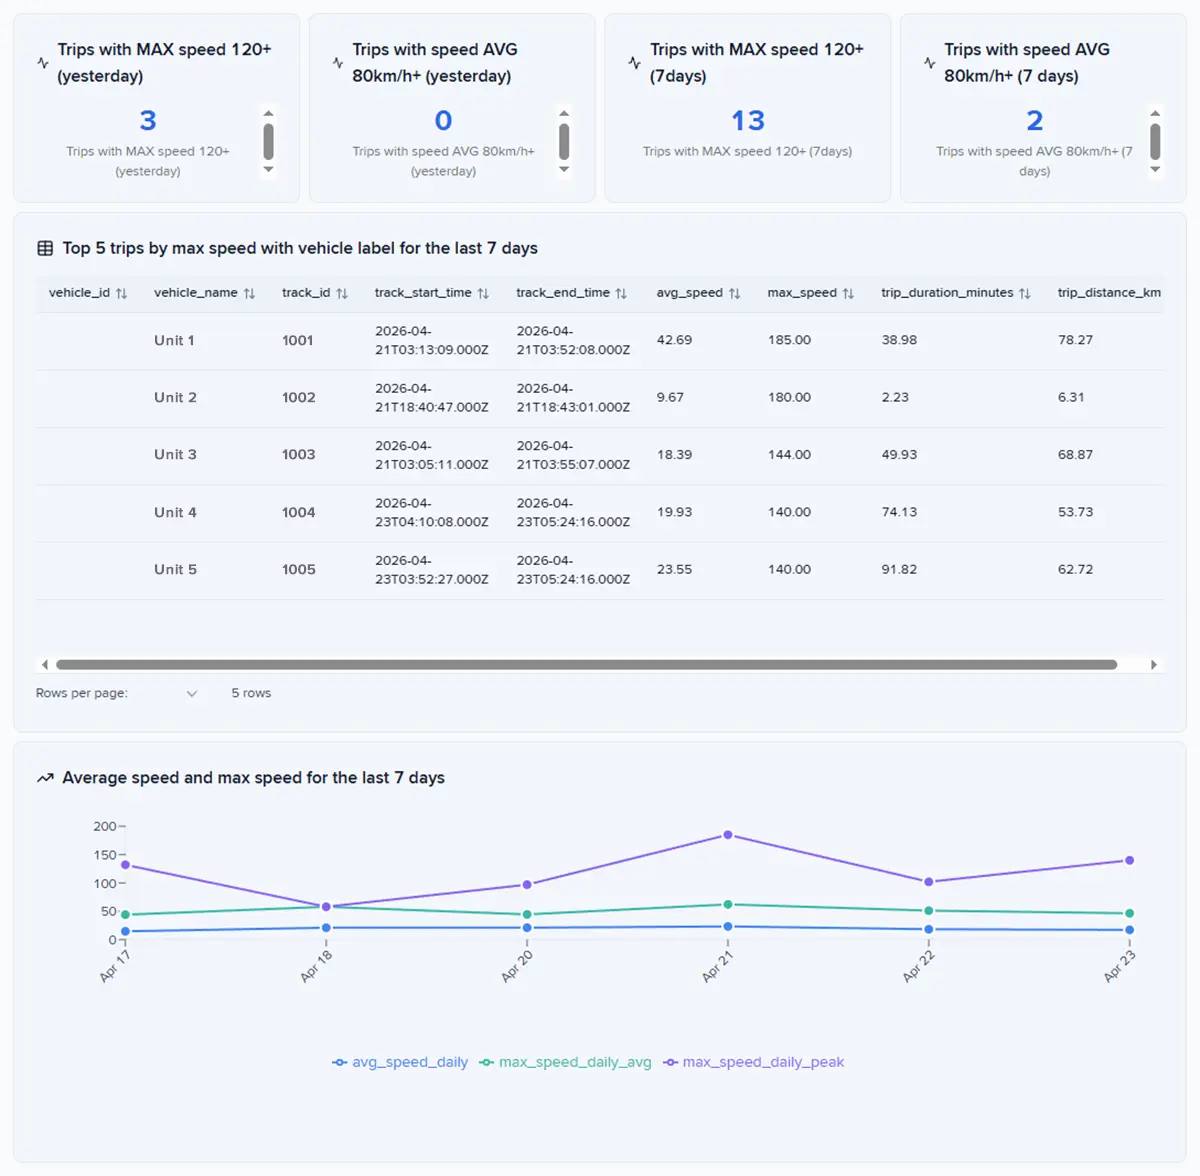
Ready dashboard templates for logistics analytics
Pre-built SQL-powered templates you can deploy immediately and customize to your operations.
Ready to see it with your logistics data?
Connect your telematics stack and get your first logistics dashboard running in under 15 minutes.