One platform. Every module works as one system.
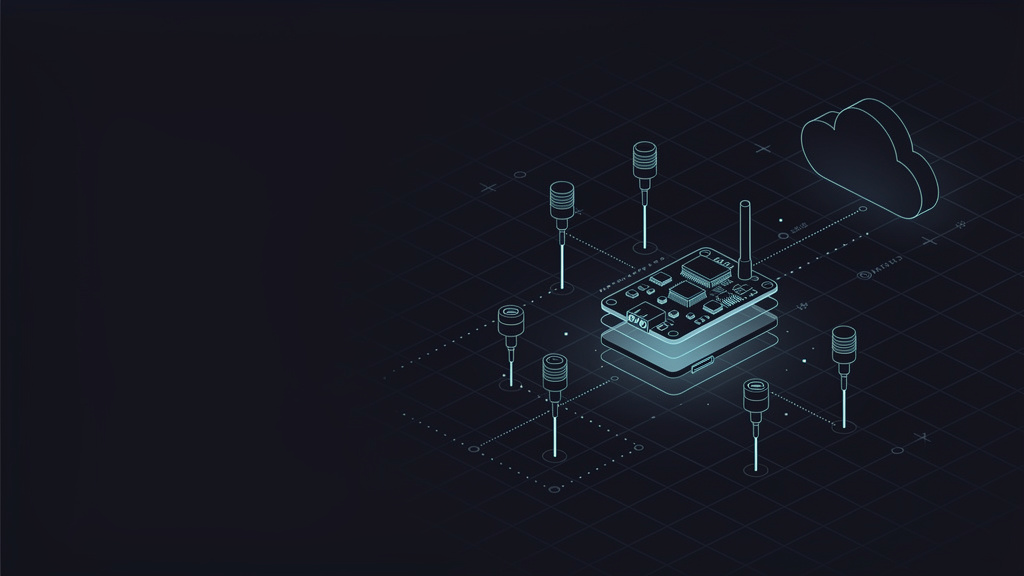
Navixy is a composable telematics platform assembled from three layers: geospatial and location intelligence software for data ingestion, IoT Logic for data automation and processing, and IoT Query with Dashboard Studio as the data transformation layer for customizable fleet analytics. These layers compose into one end-to-end system for both stationary press-containers and truck-based collection.
geospatial intelligence, real-time fleet data
data automation & processing
data transformation, customizable fleet analytics
data-layer · API · white-label
Modules that snap together into one fleet management system
The same path serves a press-container in a depot and a collection truck out in the field. Each layer hands off to the next — you adopt the whole platform, or start with one layer and grow into the rest.
- 01
Ingest — Location Intelligence
The ingestion layer normalizes data from fill sensors, OEM compactor signals, GPS, J1939/CAN, RFID and onboard weight into a single stream — device-agnostic across 2,500+ types, one ingestion layer for the entire sensor estate.
- 02
Automate — IoT Logic
The rules engine sits above the data stream: stateless rule definitions translate raw signals into decisions — threshold alarms, dual-trigger completion flags, PTO-aware idle classification, and device commands (outputs, relays, comm-profile switching). No bespoke code required.
- 03
Transform — IoT Query + Dashboard Studio
IoT Query exposes the processed stream as a SQL-queryable dataset — connect any SQL-compatible BI tool (Power BI, Superset, Streamlit and more), or query on demand by waste stream, site and period. Dashboard Studio renders queries as role-based operational panels within the platform, without a separate BI tool.
- 04
Integrate
The REST API and webhook layer exposes any captured signal or processed record downstream. Full platform, data-layer only via API, or the whole stack white-labeled under your own brand.
Modules that snap together into one system
Each module is useful on its own and stronger together. They share one device layer, one data model and one screen — so a rule you write in IoT Logic shows up in an IoT Query report and a Dashboard Studio panel without any glue code.
One data model under every module
Sensors and vehicles feed a single stream. Automation, reporting and dashboards all read the same live data — nothing is re-keyed between tools.
IoT Logic
The automation module: thresholds, dual-trigger proof, PTO-aware idle and overload rules — plus outputs, relays and device commands.
IoT Query
The reporting module: SQL-style reports for fill, routes, SLA proof, fuel, utilization and weight-based billing.
Dashboard Studio
Part of IoT Query. Role-based operational dashboards for dispatch, service delivery, maintenance and management — built on the same live data as IoT Query reports.
Device layer
The ingestion module: fill sensors, OEM compactor signals, CAN/PTO trackers, RFID and onboard scales across 2,500+ devices.
Choose your boundary — the platform adapts
Integration with Navixy is a boundary decision, not a rebuild. On the device side, 2,500+ supported types connect through one ingestion layer — no per-manufacturer SDK, no parallel data pipelines. On the output side, you define where the platform ends: full-stack for operators who want everything built in, a data-collection layer that hands normalized signals to your own system via REST API, or the whole product white-labeled under your own brand for TSPs building a waste offering.
- 2,500+ device types on one ingestion layer — add new hardware without custom integration work
- REST API and webhooks expose any captured signal or processed record to downstream systems
- Full platform, data-layer only, or white-label — the boundary is yours to define
- SDK and documentation for every integration pattern, supported by integration engineering
One data path, zero re-keying between tools
A single platform means the same sensor reading that fires an IoT Logic rule also lands in the IoT Query report and the Dashboard Studio panel — no duplicate integrations, no re-keying, no separate connectors to maintain. For integrators and TSPs, that means one codebase to support, one device library to extend, and one API to expose to downstream systems.
Device count and platform architecture figures are Navixy product data. Integration outcomes vary by scope and existing system landscape.
Bring your integration challenge to the platform
Bring one architecture question — a device type, an API endpoint, a white-label scope or a compliance export requirement. We'll map the ingestion → IoT Logic → IoT Query path through your system, and scope what one platform replaces.
Device-agnostic · REST API · white-label ready