Navixy Platform · Analytics

    Dashboard Studio

    Build deeper fleet dashboards directly in Navixy in 1 minute

    Dashboard Studio — a configurable open-source fleet analytics tool for teams that outgrew predefined reports and need to shape telematics data into their own decision center.

    Heavy Machinery Trip Operations dashboardLeasing dashboardHeavy Machinery Engine Operation dashboard

    Why do current reporting methods
    fall short?

    • Static KPIs that do not reflect your unique service model or compliance rules.
    • Fragmented analysis across Excel files, screenshots, and personal dashboards.
    • BI fatigue: internal teams hesitate to start another Power BI or Grafana project due to cost, talent needs, or maintenance burden.
    • Slow reporting cycles where critical trends are visible only in weekly or monthly summaries.
    • No clear ownership: defined roles are missing for designing, updating, or maintaining dashboards.

    Dashboard Studio resolves these competing requirements inside Navixy.

    Schedule a meeting with our expert to learn how you can enhance fleet analytics.

    Schedule a call

    Get a deeper fleet analytics layer,
    embedded where your team already works

    Dashboard Studio extends Navixy and adds flexibility
    without asking your organization to run a BI team or manage external tools.

    Dashboard Studio — Fleet Analytics Dashboard
    Dashboard Studio — Fleet Analytics Dashboard
    Dashboard Studio — Fleet Analytics Dashboard
    Dashboard Studio — Fleet Analytics Dashboard

    Drag-and-drop editor

    Build dashboards in minutes without engineering help.

    Governed self-service

    Power users define metrics and dashboards; business users rearrange and explore safely.

    Real operational clarity

    Build panels that highlight what matters to your operations.

    IoT Query-ready foundation

    For teams with analysts, dashboards can sit on top of IoT Query to bring SQL-defined KPIs directly into the visual layer.

    Create fleet management dashboards
    tailored to your KPIs

    Decision center

    Monitor fuel per km, idling, harsh events, utilization, maintenance exposure, and SLA deviations.

    Operational awareness

    Track active vehicles, route adherence, sensor values, task completion status, driver availability, and dispatch KPIs.

    Historical trend analysis

    Identify seasonal demand, cost patterns, or recurring inefficiencies to support budgeting or board reporting.

    Partner-branded analytics

    Deliver configurable, branded dashboards to your customers as part of your telematics offering.

    9 dashboard templates
    that answer every fleet question

    01

    Object status

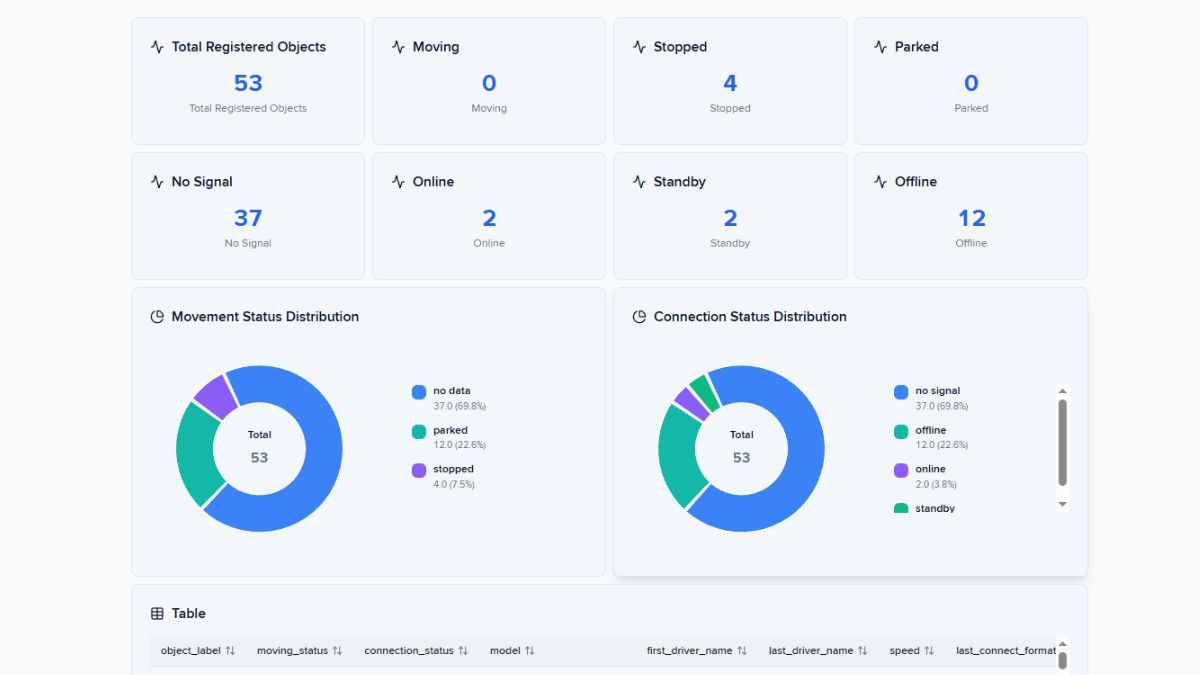
    Live view of every asset: moving, stopped, offline, or missing signal.

    02

    Trips dashboard

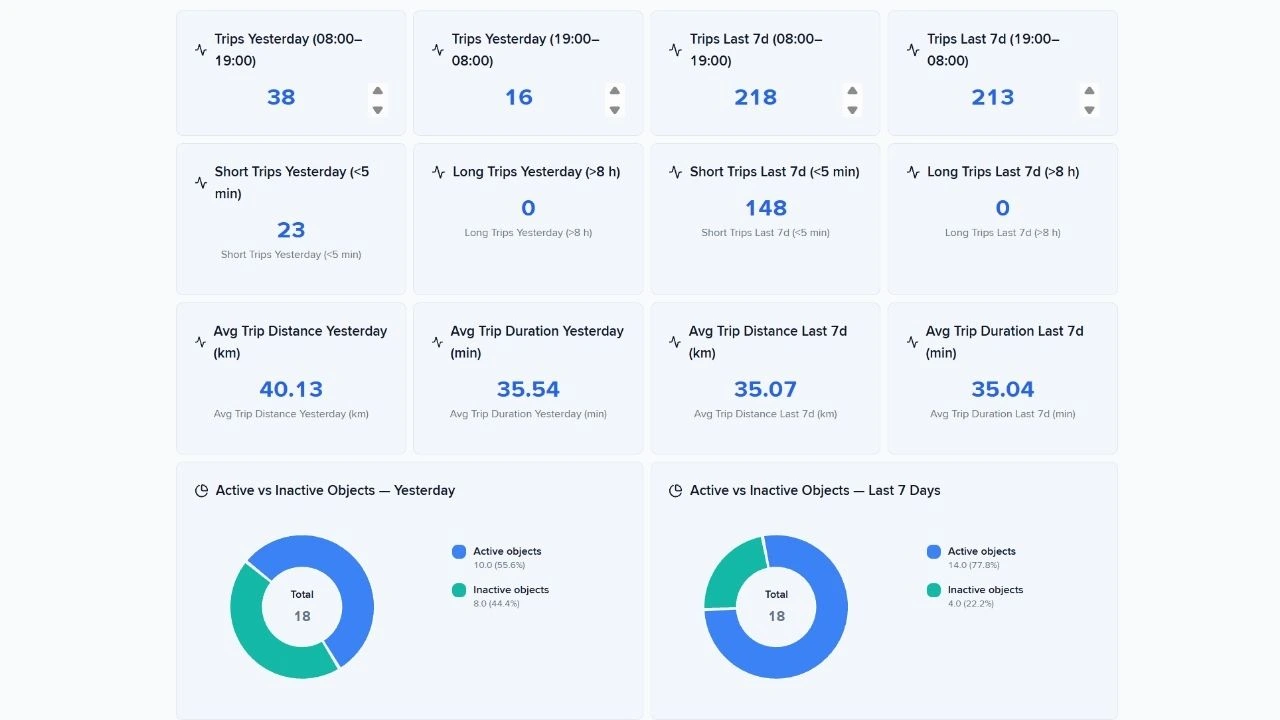
    Yesterday's fleet activity — trips, mileage, drive time, speed, and zone behavior.

    03

    Vehicle mileage

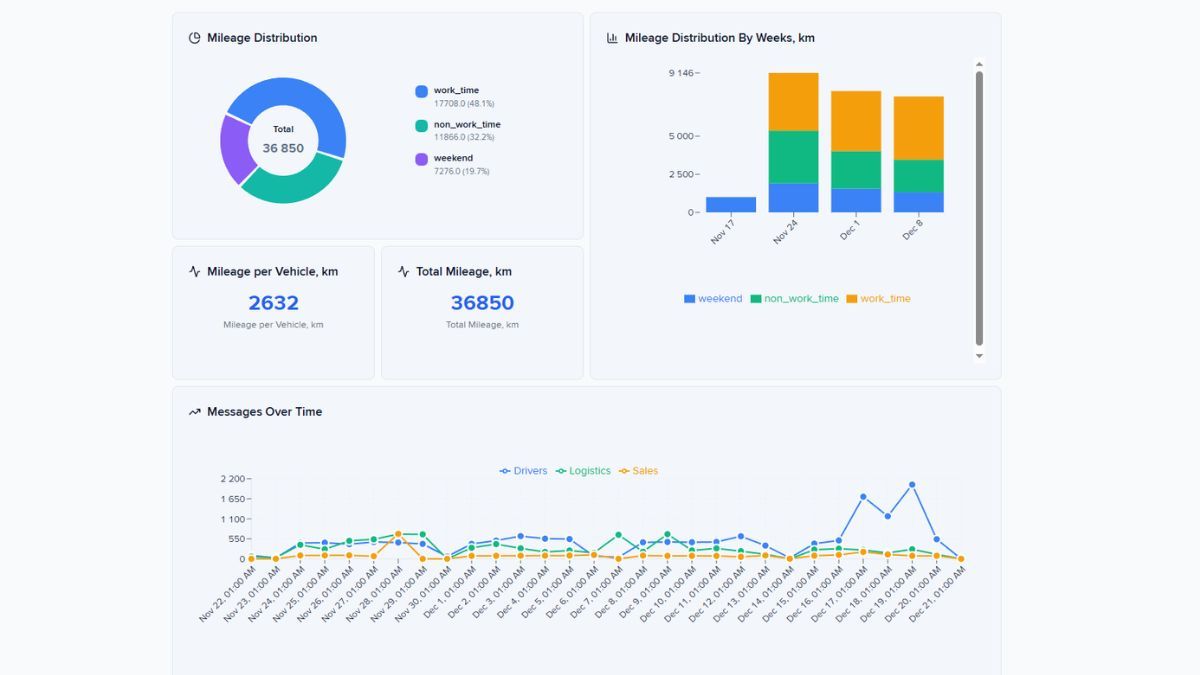
    Business hours vs. after-hours vs. weekend mileage. Unauthorized use, visible.

    04

    Trip operations

    Day and night shift trips for heavy machinery — anomalies and speed violations surfaced automatically.

    05

    Heavy machinery engine

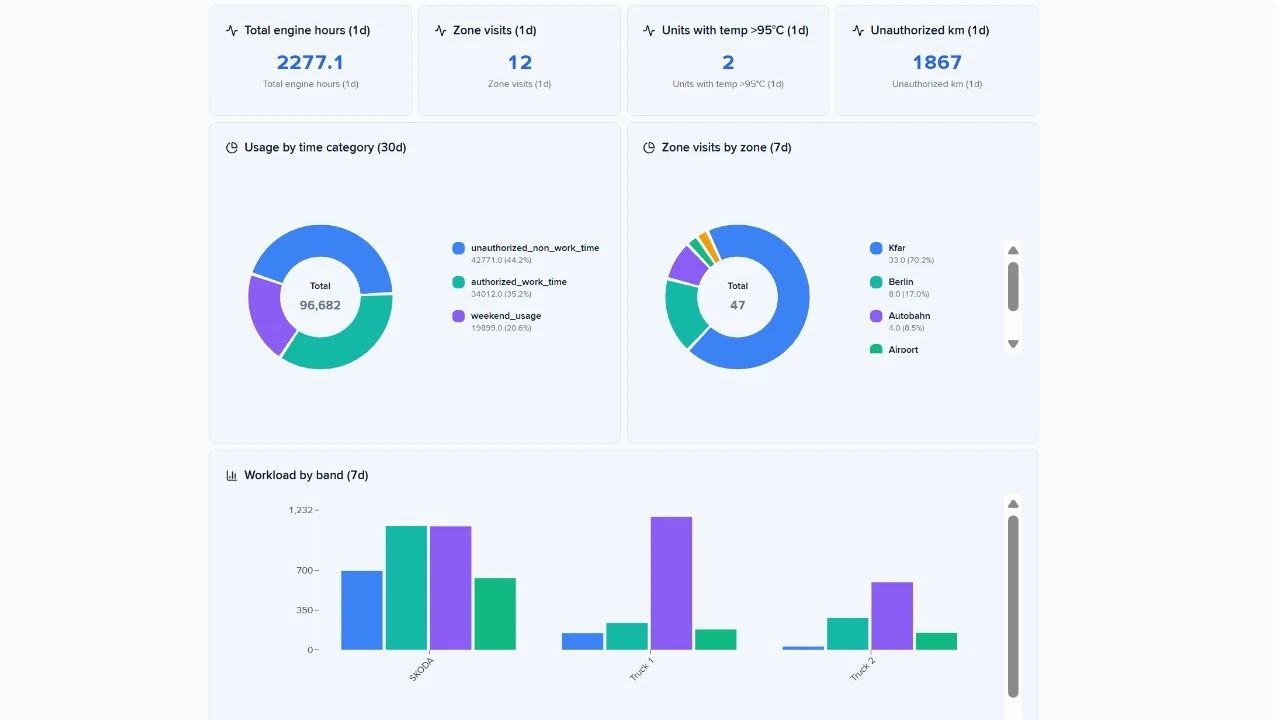
    Engine hours, temperature violations, and unauthorized mileage. Daily snapshot, weekly context.

    06

    Leasing

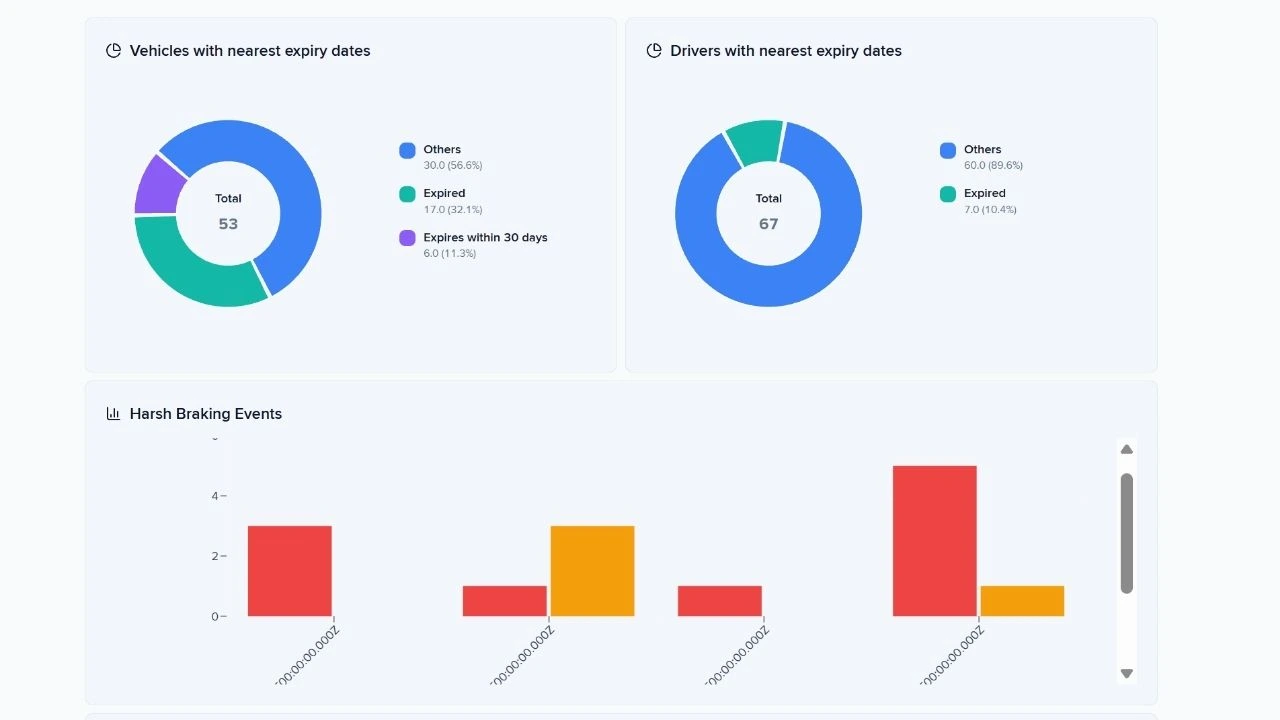
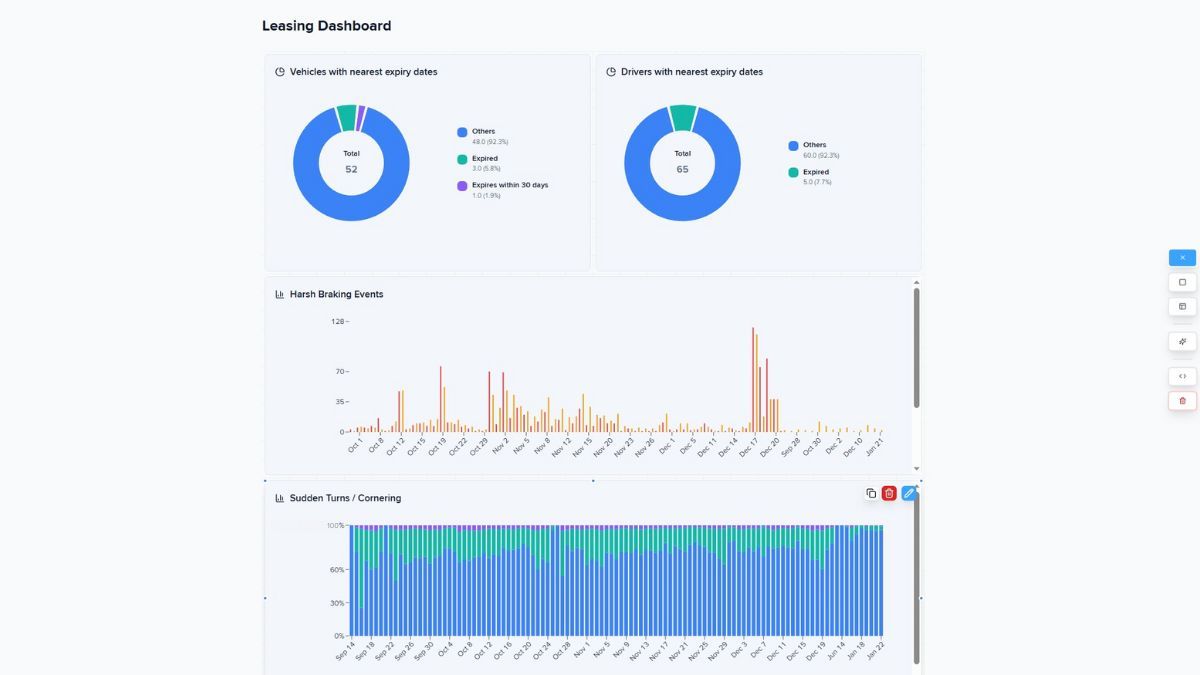
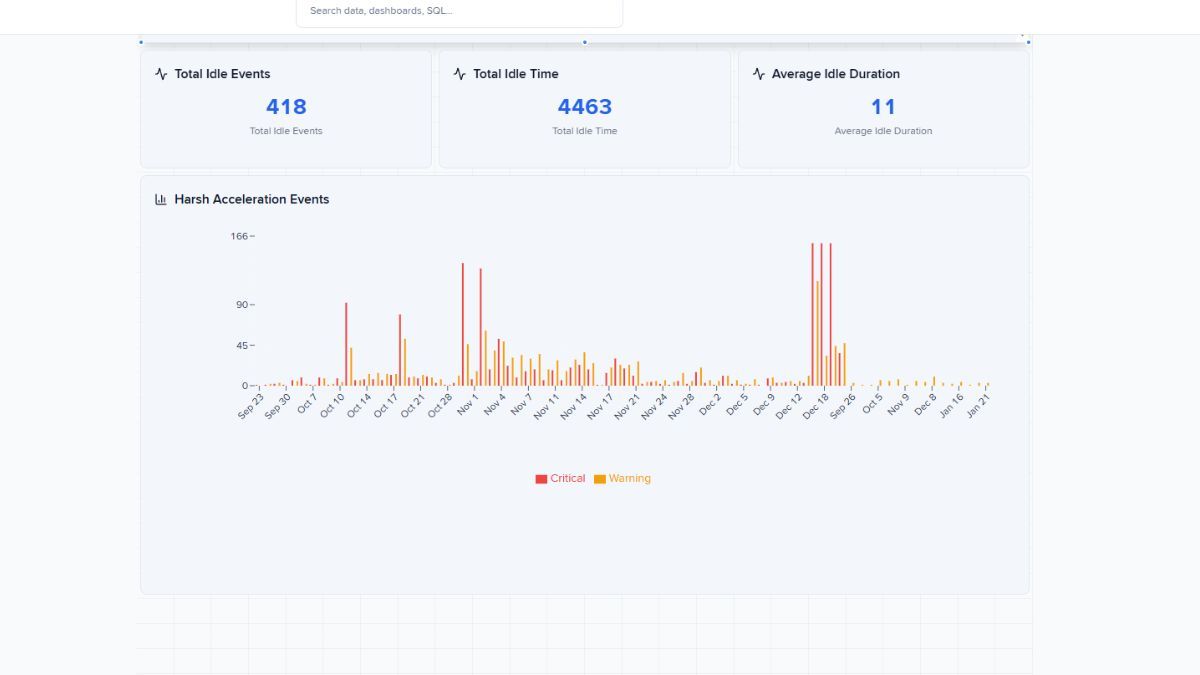
    Document expiry, harsh driving, and idle time — asset protection evidence in one place.

    07

    Fleet anomaly monitor

    GPS dropouts, long stops, zone exits. Exceptions only, no manual hunting.

    08

    Fleet performance

    30-day view: utilization, violations, safety events, geofence compliance.

    09

    Fleet reports

    Connectivity, speeding, device voltage, average mileage — daily supervisor control.

    Build custom reports
    that drive business decisions

    Your business context

    Start with a clear question — e.g., "Which regions show increasing idle time this quarter?"

    One SQL query, three-view output

    Use a single SQL query that feeds all report components — saving time and preserving consistency.

    Configurable interactive components

    Customize which views you include (a table, a chart, a map) and choose how stakeholders will interact with the data.

    Several export options

    Download polished reports in Excel, CSV, HTML, or PDF — ready for analysis, integration, presentations, or compliance.

    Ready to build your own fleet decision center?

    Enable Dashboard Studio to support your teams with a deeper analytics layer that fits your operations, KPIs, and customers.

    Frequently asked questions
    about custom fleet analytics

    Learn more about Dashboard Studio

    Dashboard Studio: get custom fleet analytics in less than a minute
    Read a blog post

    Dashboard Studio: get custom fleet analytics in less than a minute

    Navixy introduces Dashboard Studio, an embedded data visualization tool that lets fleet teams create custom panels for their specific workflows and KPIs without external services or BI projects.

    How to create a custom dashboard in minutes
    Watch a video

    How to create a custom dashboard in minutes

    Watch a step-by-step video guide showing how to build your first custom fleet dashboard using Dashboard Studio's drag-and-drop interface.

    Dashboard Studio Documentation
    Explore Documentation

    Dashboard Studio Documentation

    IoT Query gives you direct access to your data. Dashboard Studio transforms that access into visual answers through custom dashboards without requiring external business intelligence platforms.