Build the fleet analytics you actually need
IoT Query turns telematics data into a first-class analytical data source, compatible with all major BI tools and Python/R ecosystems.
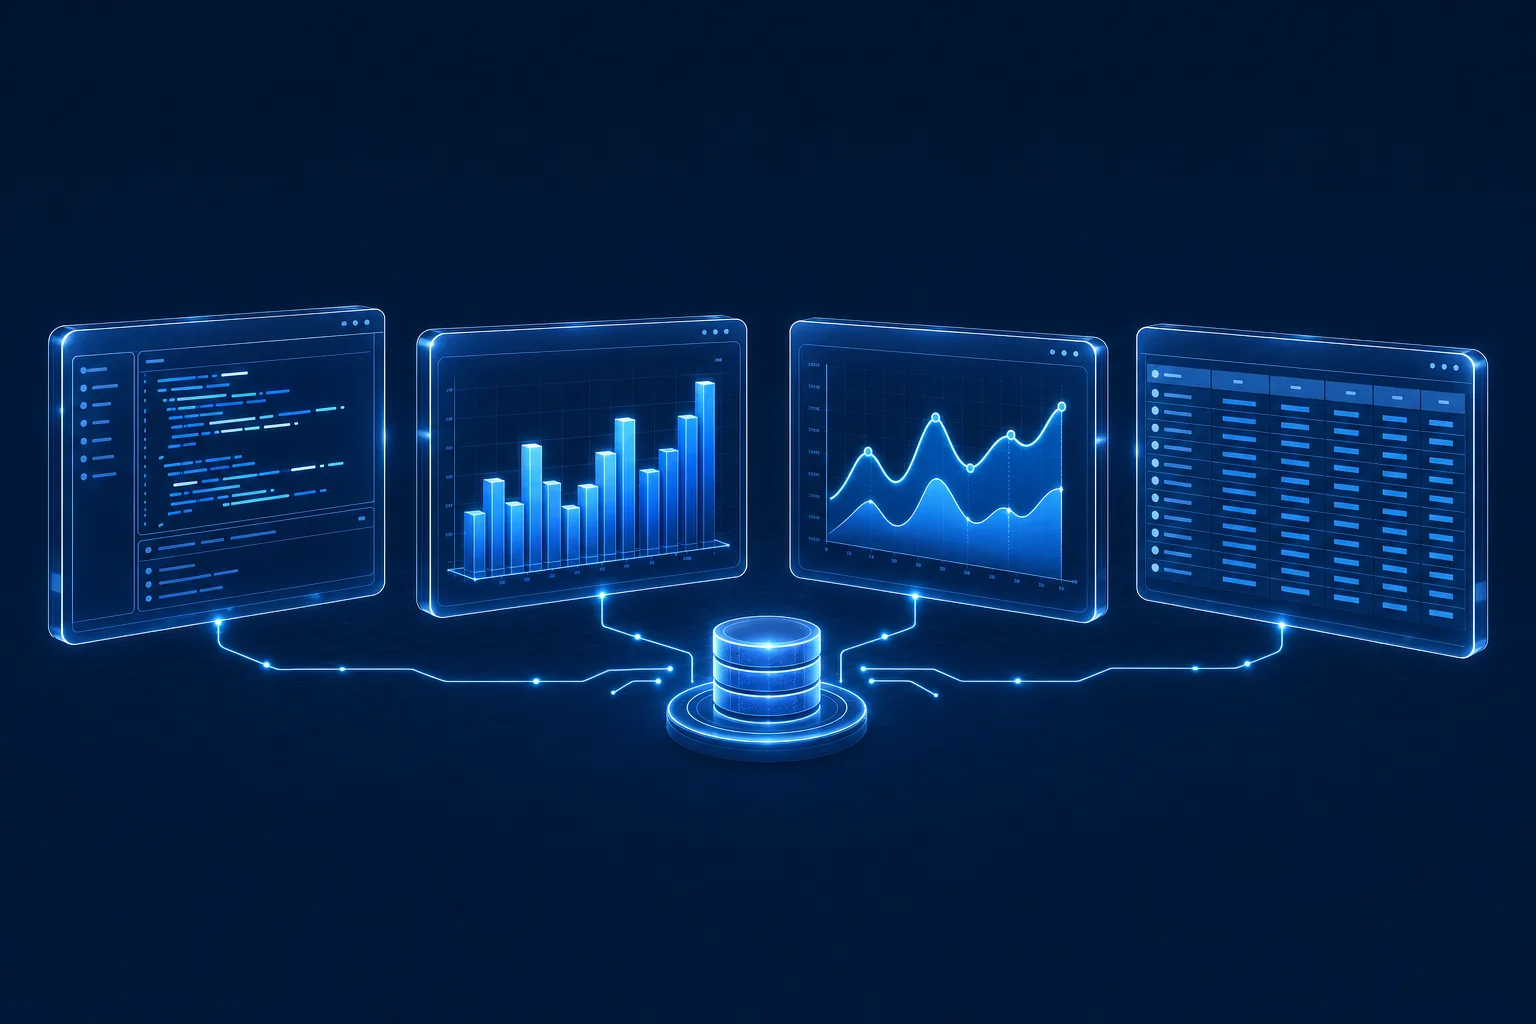
Dashboard Studio: BI built right into Navixy
Not every team wants to stand up an external BI stack. Dashboard Studio is Navixy's own no-code analytics tool, built directly on top of your IoT Query raw, transformation, and business-metrics layers — so you get production-ready fleet dashboards without writing a line of SQL or connecting an external BI tool.
No-code dashboard builder
Drag and drop stat tiles, charts, and tables directly on your IoT Query data — no SQL or BI license required.
Ready-made templates
Start from prebuilt dashboards for fleet, maintenance, and compliance use cases, then tailor them to your own KPIs.
One-click custom reports
Deliver stakeholder-ready reports in Excel, HTML, or PDF without rebuilding analytics or reworking data.
Connect your favorite BI tools in minutes
IoT Query works with any SQL-capable tool. Choose what fits your team best — from enterprise reporting platforms to lightweight open-source dashboards.
Power BI
For corporate reporting & governance. Enterprise-grade dashboards with Active Directory integration.
Superset / Metabase
For embedded or lightweight dashboards. Open-source, easy to deploy, great for internal tools.
Python + Streamlit
For custom domain apps and open-source dashboarding projects. Maximum flexibility and control.
Tableau / Looker
For advanced visualizations and enterprise analytics. Connect via standard Postgres driver.
SQL-first, tool-agnostic analytics
IoT Query provides a PostgreSQL-compatible endpoint — connect from any SQL-capable tool. API-less means no rate limits and complete schema visibility.
Use standard Postgres drivers and SQL syntax. Connect from anywhere — Power BI, Tableau, Python, R, or even Excel.
Query as much data as you need, whenever you need it. No throttling, no pagination, no waiting for exports.
Browse all tables, columns, and relationships. Understand your data structure at a glance with full metadata access.
Get credentials → add Postgres connection in Power BI/Tableau/Superset/Metabase → start building dashboards.
Access raw sensor data for custom feature extraction with SQL & Python
Use cleansed, enriched data with derived KPIs for ML training
Integrate trained models back into Navixy platform via IoT Logic or APIs
Predictions and AI-driven features flow into Dashboard Studio, BI tools, and IoT Logic automations — closing the loop from raw data to action
From dashboards to ML & AI
IoT Query's layered architecture enables data science teams to build predictive models, optimize operations, and create AI-driven features using full-fidelity telematics data.
Build models to forecast component failures weeks in advance based on sensor patterns and historical repair data.
Train models on historical trip data, traffic patterns, and weather to optimize routes and predict accurate ETAs.
Calculate driver risk scores and eco-driving metrics for insurance underwriting and tender evaluations.
Future analytics capabilities
IoT Query is continuously evolving. Here's what's coming next to make your analytics even more powerful.
PostGIS-compatible geospatial functions
Perform geofence and route analysis directly in SQL. Check if coordinates fall inside zones or calculate distances between points.
Time-window helpers
Filter by shift schedules, working hours, or custom recurring time periods inspired by iCalendar logic — no complex SQL required.
Pre-built business metrics data marts
Ready-made analytical datasets for eco-driving, maintenance, logistics, and support — plug and play for common use cases.
Natural-language querying
Ask a question about your fleet in plain English and get an instant, accurate answer — conversational AI built directly on top of your IoT Query data, no SQL required.
Book a technical walkthrough for your data team
Our analytics experts will walk you through IoT Query capabilities, show how to connect your tools, and discuss your specific use cases and KPIs.